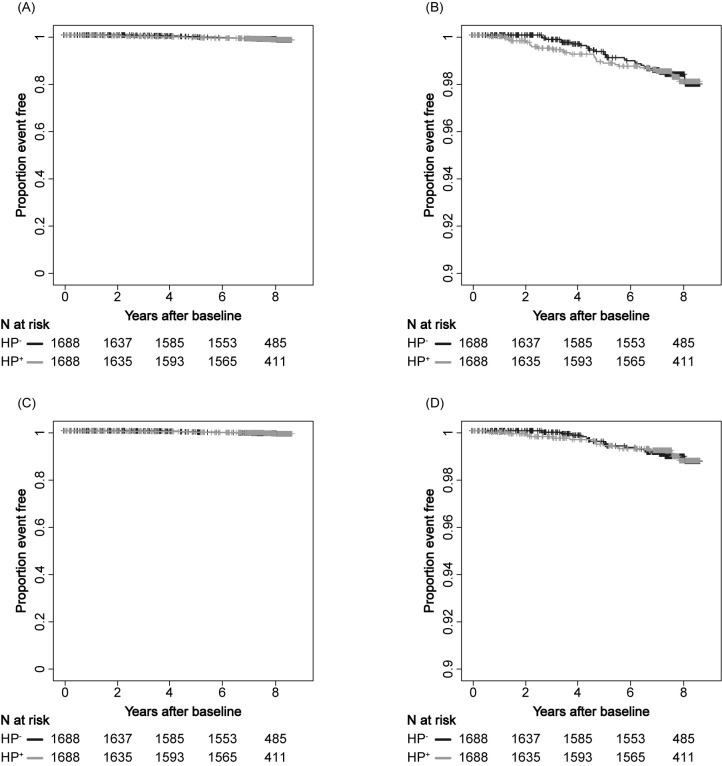
Fig 4. All-cause and cancer-specific deaths.
Kaplan-Meier estimation of all-cause deaths (A, B) and deaths due to cancer (C, D) stratified by anti-HP antibody status. Cancer type includes gastric, uterine, lung, prostate, colon, and breast. The black line indicates HP+ and the gray line indicates HP-. Panels B and D are partially enlarged views of panels A and C, respectively. A and C, vertical axis range 0.00–1.00; B and D, vertical axis range 0.90–1.00.

