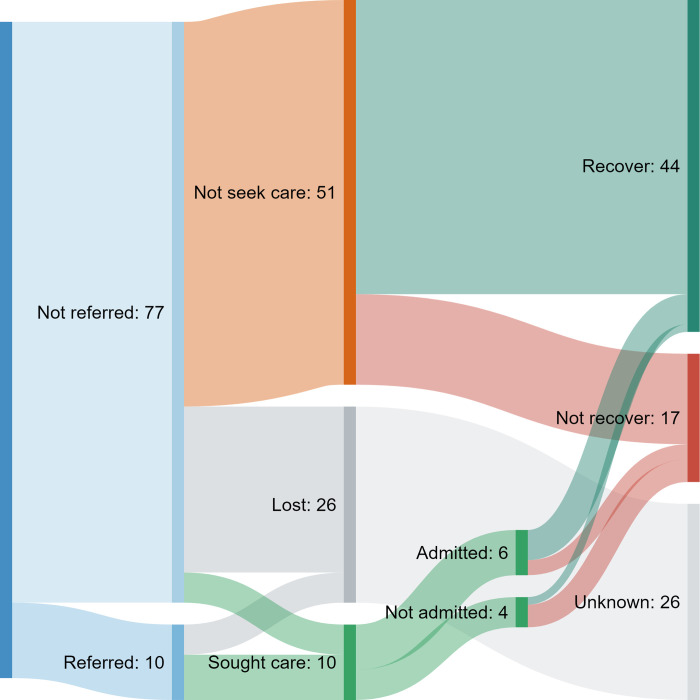
Fig 3. Flow chart showing referral, facility attendance, and day 7 outcomes for 87 children with hypoxaemia SpO2<93%.
Numbers correspond to the underlying panel and adjacent coloured bar (right) depicting how many participants from one category progressed to the next category. Individual participant care pathways are not depicted.

