Figure 3.
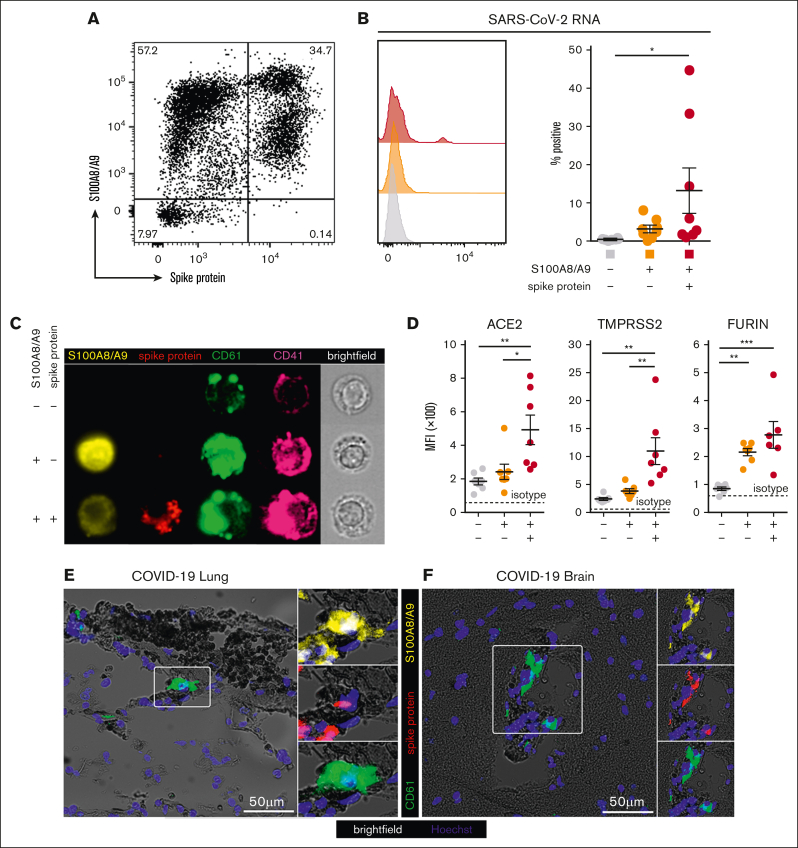
A subpopulation of S100A8/A9+ MKs contain SARS-CoV-2. (A) Representative flow cytometry plot of circulating MKs showing 3 distinct subpopulations: S100A8/A9− spike protein–negative, S100A8/A9+ spike protein–negative, and S100A8/A9+ spike protein–positive. (B) Histogram showing PrimeFlow flow cytometry for SARS-CoV-2 RNA in circulating MKs. Quantification of SARS-CoV-2 RNA in the 3 MK subpopulations (n = 8 donors). One-way ANOVA with Tukey post hoc multiple comparisons test; adjusted P value is ∗P = .05 to .01 (C) Representative imaging flow cytometry from FACS-sorted MKs: S100A8/A9− spike protein–negative, S100A8/A9+ spike protein–negative, and S100A8/A9+ spike protein–positive. (D) Expression of proteins involved in SARS-CoV-2 viral infection in the 3 MK subpopulations (n = 7 donors). Mean fluorescent intensity of ACE2, TMPRSS2, and FURIN. Dashed lines represent the geometric mean for isotype controls. One-way ANOVA with Tukey post hoc multiple comparisons test; ∗P = .05 to .01; ∗∗P = .01 to .001; ∗∗∗P = .001 to .0001. (E) Immunofluorescence staining of lung tissue from a deceased patient who had COVID-19 with ARDS. (F) Immunofluorescence staining of brain tissue (cortex) from a deceased patient who had COVID-19. Five channels are shown in panels E-F: brightfield (black pigment from TrueView autofluorescence quencher), green (CD61), yellow (S100A8/A9), red (spike protein), and blue (Hoechst). All graphs are mean ± SEM. TMPRSS2, transmembrane protease serine 2.

