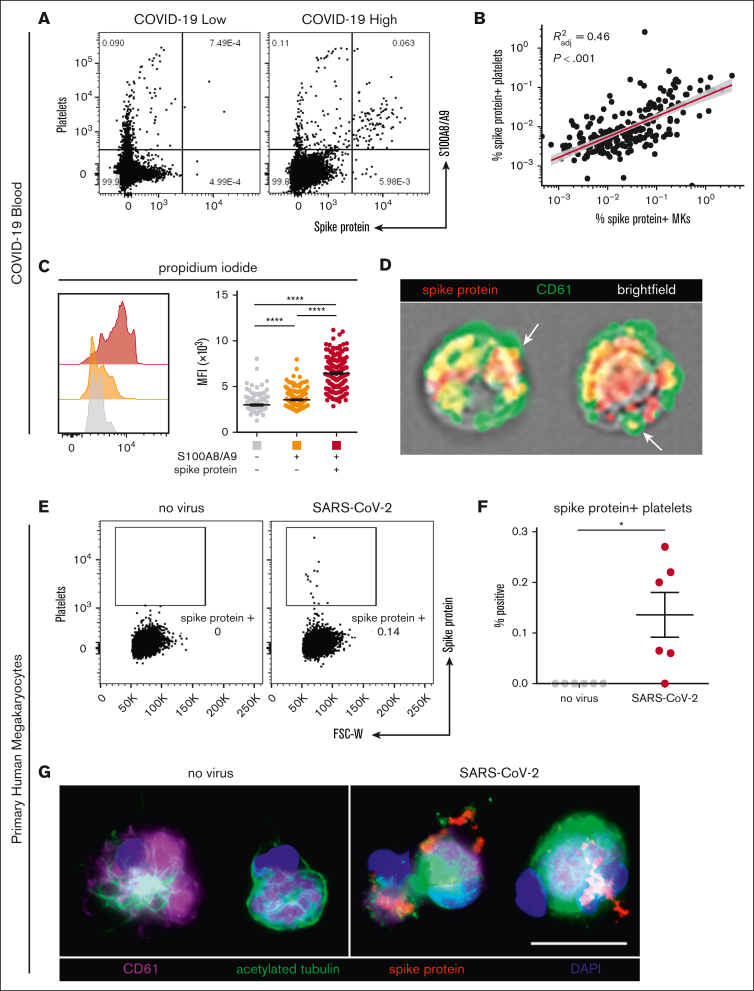
Figure 4.
SARS-CoV-2–containing MKs transfer viral antigen to platelets. (A) Representative flow cytometry plots of platelets from patients with COVID-19 with high and low virus–positive proportions. (B) Linear regression comparing virus–positive MK frequencies to virus–positive platelet frequencies (n = 218 patients; 220 samples). (C) DNA content analysis in circulating MKs using propidium iodide and RNase treatment. Quantification of DNA content in the 3 MK subpopulations (n = 218 patients; 220 samples). One-way ANOVA with Tukey post hoc multiple comparisons test; adjusted P value is ∗∗∗∗P < .0001. (D) Imaging flow cytometry of virus–positive MKs. White arrows indicate viral protein in emerging platelets. (E) Flow cytometry plots of platelets from primary human MKs infected with SARS-CoV-2 showing spike protein–containing platelets. (F) Quantification of virus+ platelets from primary human MKs (n = 6 cultures). Unpaired two-tailed t test; ∗P = .05 to .01. (G) Immunofluorescence of primary human MKs infected with SARS-CoV-2. Four channels are shown: CD61 (purple), acetylated tubulin (green), spike protein (red), and 4′,6-diamidino-2-phenylindole (DAPI; blue). All graphs show mean ± SEM.

