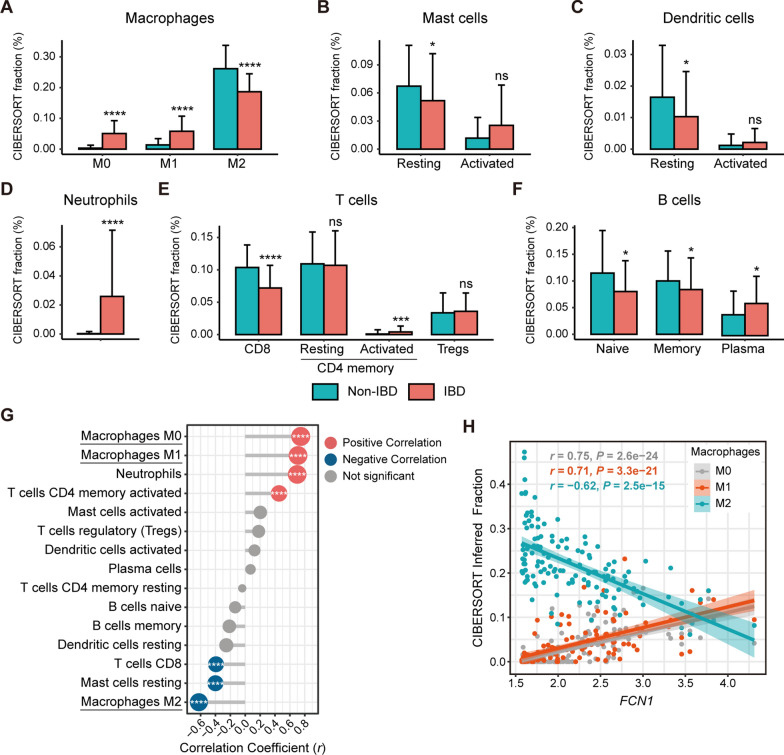
Fig. 3.
Positive correlation between FCN1 expression and M0/M1 macrophage infiltration. CIBERSORT inferred abundance of macrophages A, mast cells B, dendritic cells C, neutrophils D, T cells E and B cells F in rectal biopsies from PIBD and non-IBD subjects (GSE117993). Kruskal–Wallis test was employed to calculate P values. *P < 0.05, **P < 0.01, ***P < 0.001, ****P < 0.0001. G Spearman correlations between FCN1 expression and CIBERSORT inferred abundance of infiltrating immune cells. Dot size is proportional to strength of correlation and dot color indicates significance of correlation coefficient (significant positive correlation with Bonferroni corrected P < 0.05: red, significant negative correlation: blue, otherwise gray). **** denotes Bonferroni corrected P < 0.0001. H Scatter plots of the tissue expression of FCN1 and CIBERSORT inferred abundance of macrophage subsets (M0, M1, M2) in the GSE117993 cohort. The 95% confidence intervals for the correlation between FCN1 expression and macrophages are (0.66, 0.81) for M0, (0.61, 0.79) for M1, and (-0.72, -0.51) for M2

