Fig. 4.
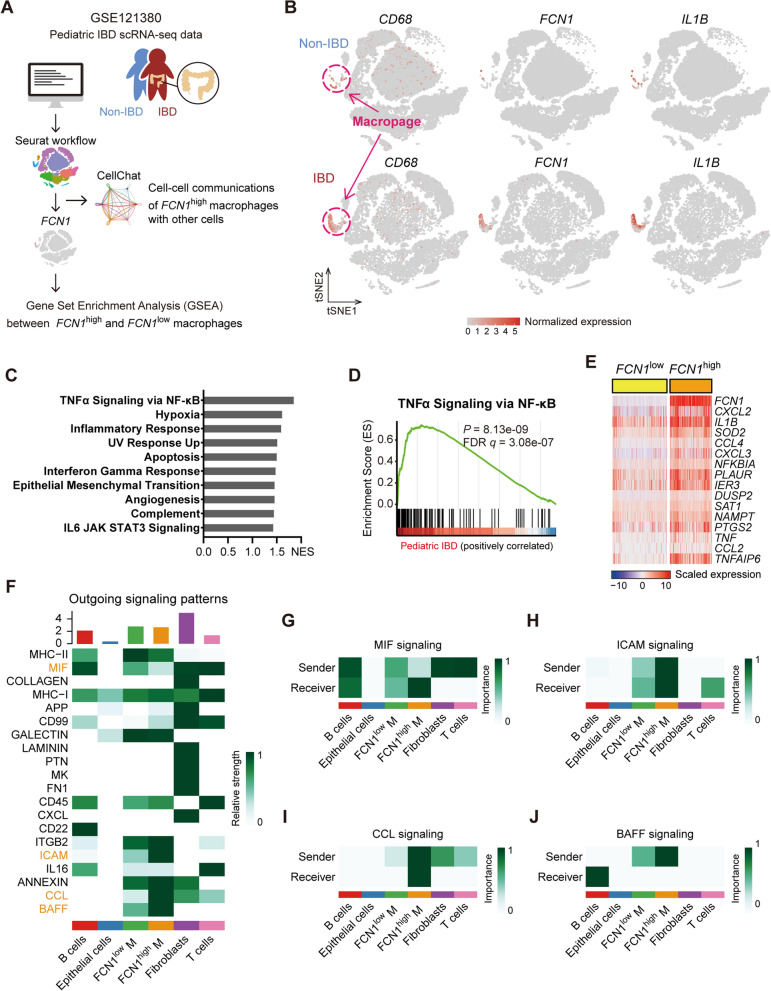
FCN1 is enriched in macrophages of PIBD colon mucosa and related to hyper-inflammation. A Diagram depicting the analysis scheme of public single-cell RNA sequencing data (GSE121380). B t-SNE plots of CD68 (macrophage marker), FCN1 and IL1B at the single-cell level. C The bar plot of significantly enriched GSEA Hallmark pathways in FCN1high macrophages compared with FCN1low macrophages. D The enrichment plot of TNFα Signaling via NF-κB pathway. E Heatmaps of FCN1 and the top 15 up-regulated genes of TNFα Signaling via NF-κB pathway in FCN1high compared with FCN1low macrophages. F The heatmap showing the overall outgoing signaling patterns of major cell types, including B cells, epithelial cells, FCN1low macrophages, FCN1high macrophages, fibroblasts, and T cells, as predicted by CellChat. G-J Heatmaps of differential signaling networks between FCN1low macrophages and FCN1high macrophages, including MIF signaling, ICAM signaling, CCL signaling, and BAFF signaling

