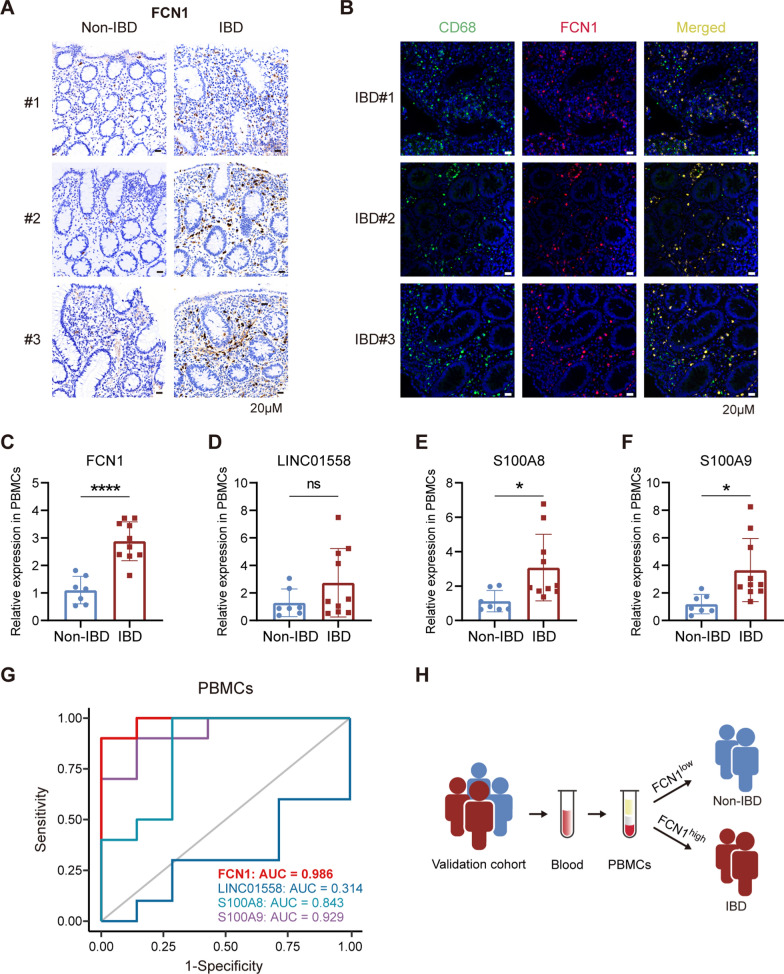
Fig. 5.
Validation of the diagnostic efficacy of FCN1 in our patient cohort. A Immunohistochemistry staining showing increased infiltration of FCN1+ cells in colon biopsies of IBD compared with non-IBD subjects. B Immunofluorescence staining showing that FCN1+ cells (red) colocalize with CD68+ cells (green) in the colon biopsies of children with IBD. Yellow indicates double positive cells. C-F Relative mRNA expression levels of FCN1, LINC10558, S100A8, and S100A9 in PBMCs from our validation cohort were measured by qRT-PCR. Data represent mean ± SD. Unpaired t test was employed to calculate P values. *P < 0.05, ****P < 0.0001. G ROC curves and their corresponding AUCs of FCN1, LINC01558, S100A8, and S100A9 based on relative mRNA expression levels in PBMCs from our validation cohort. H Based on PBMCs isolated from whole blood, FCN1 showed superior sensitivity and specificity for discriminating PIBD patients from non-IBD controls in our validation cohort

