Fig. 2.
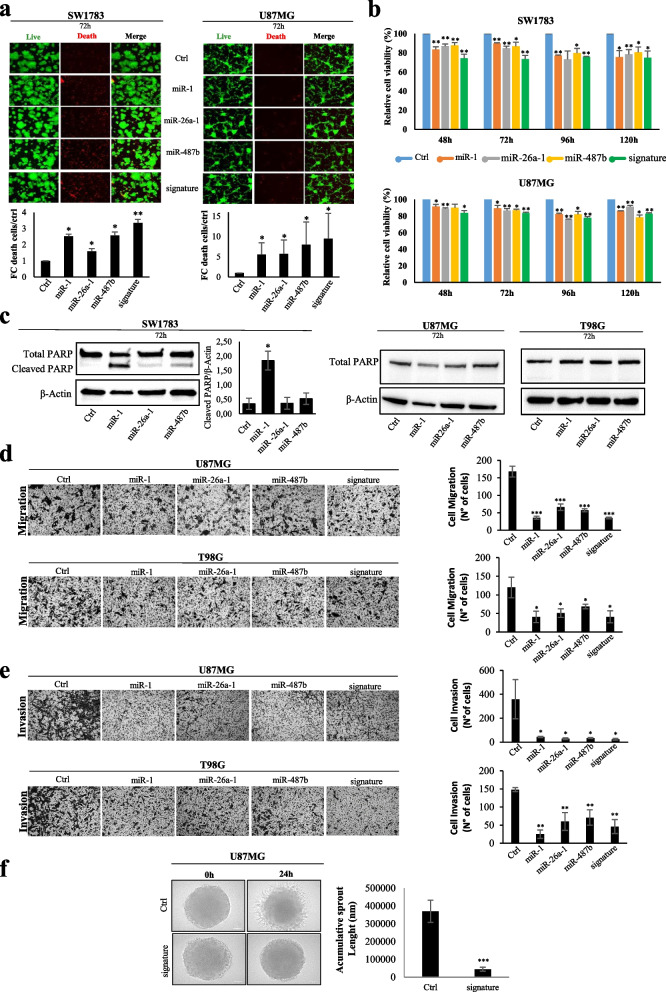
Biological effects of miR-1-3p/−26a-1-3p/−487b-3p ectopic expression in IDH-wt glioma cells. Analysis of a) Cell viability by Cyto3D™Live-Dead assays and b) cell proliferation in SW1783 and U87MG cell lines after 48, 72, 96 and 120 hours of transfection with individually or combined indicated miRNA-mimics. Cell viability values are expressed as fold change of death cells respect to control and proliferation as optical density at 750 nm wavelength, proportional to the quantity of metabolically active cells. c) Western blots of a representative experiment of total and cleaved-PARP in the indicate glioma cells after 72 h of miR-1, miR-26a-1 and miR-487b ectopic expression. Actin was used as loading control within the same sample and expressed as fold changes compared to control. Densitometric analysis by imageJ software for SW1783 glioma cells is shown. Analysis of 2D d) migration and e) invasion, by Transwell systems, of high-grade glioma cells 72 h after single or combined transfection with the indicated miRNAs. f) 3D-invasion assay with spheroids of glioma high-grade cells transfected with miRNA-mimic combination or negative control (Ctrl). The quantification of sprouts length 24 h after spheroid formation is reported. All the values are reported as mean of at least three experiments. Error bars indicate the standard deviation. * = p ≤ 0.05, ** = p ≤ 0.01, *** = p ≤ 0.001

