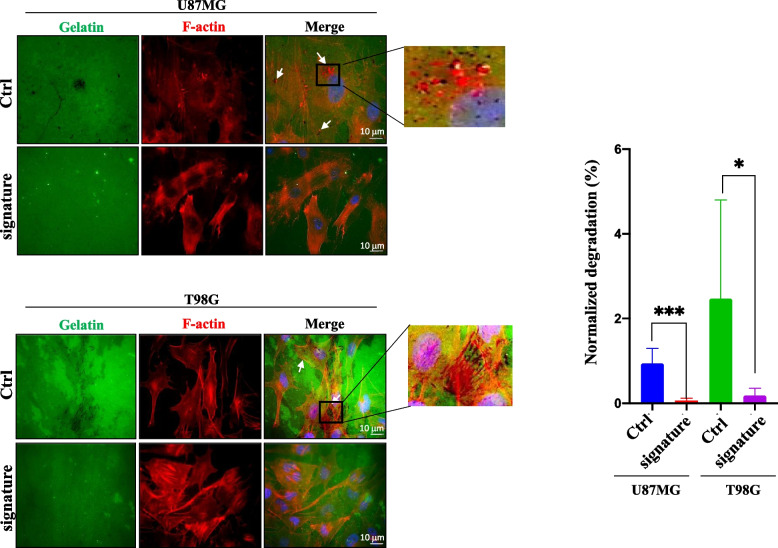
Fig. 5.
Inhibition of invadopodia activity by miR-1-3p, miR-26a-1-3p and miR-487b-3p signature. Immunofluorescence analysis of U87MG and T98G cells, transfected with the three-miRNA signature or negative control, plated onto gelatin matrix (green) and cultured for 72 h. Representative images show F-actin structures (red), and nuclei (blue, DAPI). Co-localization of areas of degraded gelatin (black) and F-actin structures is shown in merged images (pink dots indicated by arrows) and reported as zoomed pictures. Experiments were done in triplicates by imaging > 10 fields of view and > 5 cells in each sample. Scale bar = 10 μm Histograms indicate the means±SD of normalized degradation area percentage of cells. * = p ≤ 0.05, *** = p ≤ 0.001

