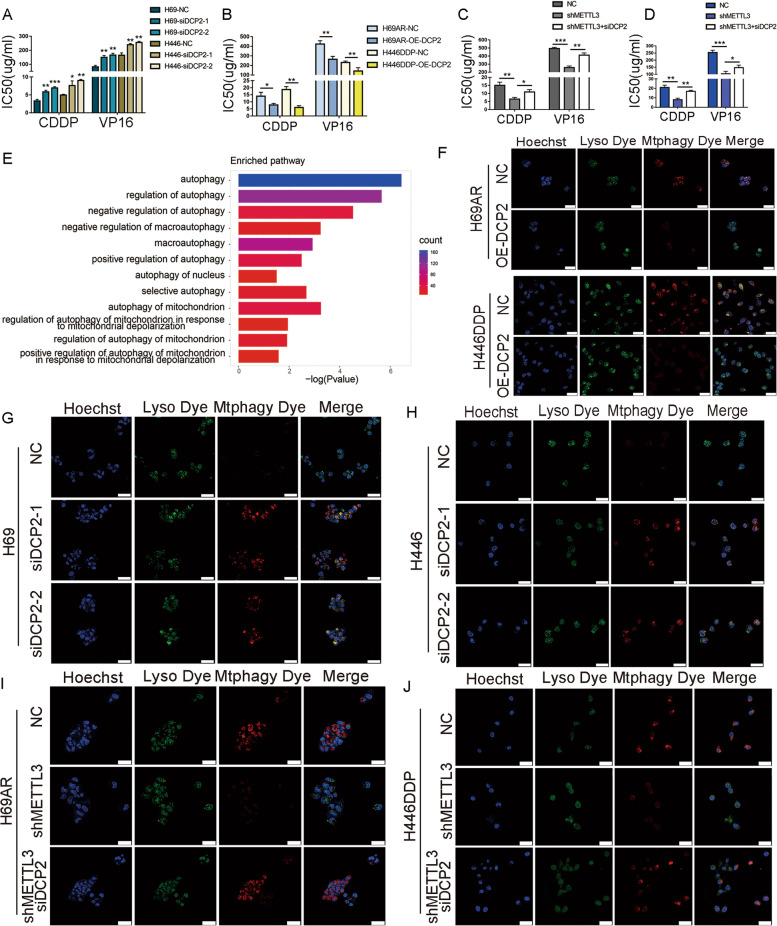
Fig. 5.
DCP2 prevents SCLC chemoresistance by regulating mitophagy. A CCK-8 assays show that knockdown of DCP2 increased the IC50 values of chemotherapeutic drugs for the chemosensitive H69 and H446 cell lines. *P < 0.05; **P < 0.01; ***P < 0.001. B CCK-8 assays show that DCP2 overexpression decreased the IC50 values of chemotherapeutic agents for the chemoresistant H69AR and H446DDP cell lines. *P < 0.05; **P < 0.01. C-D CCK-8 assays showing the effect of simultaneous METTL3 and DCP2 knockdown on the IC50 of chemotherapeutic drugs for H69AR and H446DDP cells. *P < 0.05; **P < 0.01; ***P < 0.001. E Histogram showing the significantly enriched autophagy-related pathways after GO pathway enrichment analysis of MeRIP-seq data. F Mtphagy images show mitophagy fluorescence, and merged images show colocalization between mitochondrial and lysosomal dyes in SCLC cells overexpressing DCP2 following chemotherapeutic drug treatment. Scale bar represents 25 μm. G-H Mtphagy images show mitophagy fluorescence, and merged images show colocalization between mitochondrial and lysosomal dyes in DCP2-knockdown SCLC cells after chemotherapeutic drug treatment. Scale bar represents 25 μm. I-J Mtphagy images show mitophagy fluorescence, and merged images show colocalization between mitochondrial and lysosomal dyes in SCLC cells with simultaneous knockdown of METTL3 and DCP2 following chemotherapeutic drug exposure. Scale bar represents 25 μm

