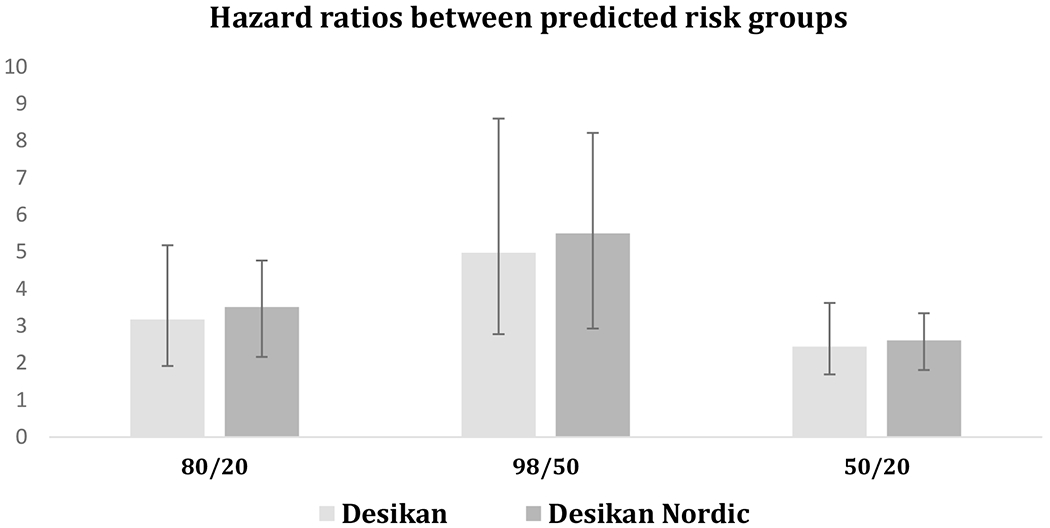
Figure 2.

Hazard ratios between different risk groups obtained by Desikan model (light gray) and Desikan Nordic model (dark gray) in DemGene population. Ratios represent high to low risk (the top 20% to bottom 20% percentile) (left), extremely high to medium low risk (the top 2% to bottom 50% percentile) (middle) and medium high to low risk (the top 50% to bottom 20% percentile) (right).
