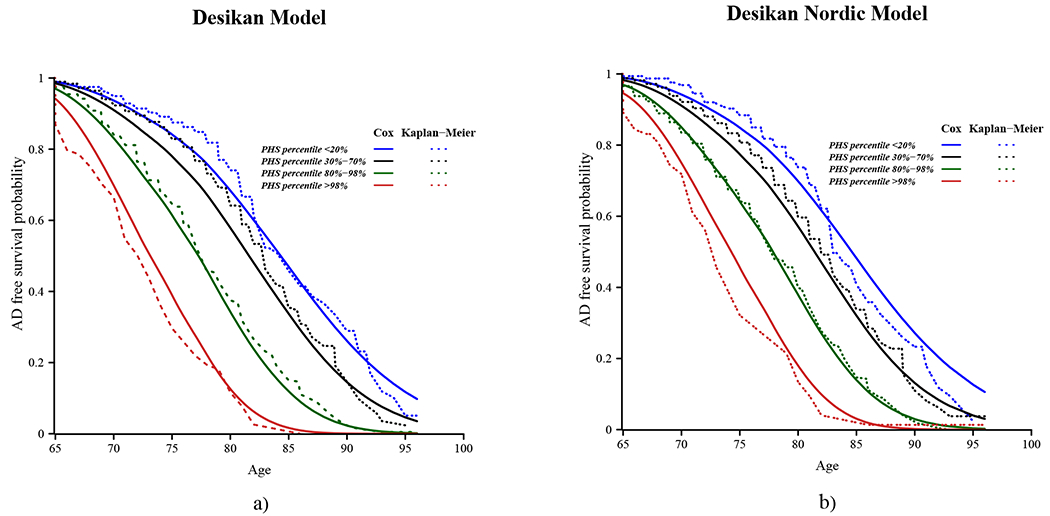
Figure 3.

Cumulative survival with age in the Nordic population used to develop the Desikan Nordic model (11 out of 12 cohorts of the DemGene cohort, excluding the Nord Norge cohort) for different polygenic hazard score percentiles predicted by a) Desikan and b) Desikan Nordic PHS model. The solid lines show the survival estimated by Cox proportional hazards assumption, with 95% confidence intervals shown shaded, and the dashed lines show Kaplan-Meier estimates. The risk groups are defined by below 0.2 PHS percentile (blue), mid 40% PHS percentiles, i.e. between 0.3-0.7 (black), between 0.8-0.98 (green) and above 0.98 (red) PHS percentiles.
