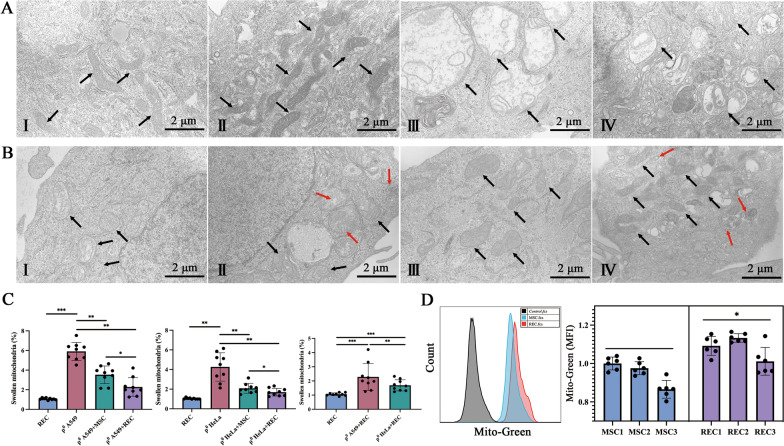
Fig. 3.
Transmission electron microscopic image of mitochondria in the direct contact system. A (I–IV) Represent mitochondria in MSC, REC, ρ0 A549, and ρ0 HeLa, respectively. B Shows the mitochondrial morphology of ρ0 A549 cells after 24 h co-culture with MSC (I) and REC (II). B Shows the mitochondrial morphology of ρ0 HeLa cells after 24 h co-culture with MSC (III) and REC (IV). The black arrow points to mitochondria. Red arrows point to mitochondria in microvesicles. This was confirmed in three independent ρ0 cells. C Quantification of swollen mitochondria. D Flow cytometry quantification of mitochondria from MitoTracker Green-labeled MSC and REC following their 24-h incubation. Data were based on three independent experiments. *p < 0.05, **p < 0.01, ***p < 0.001

