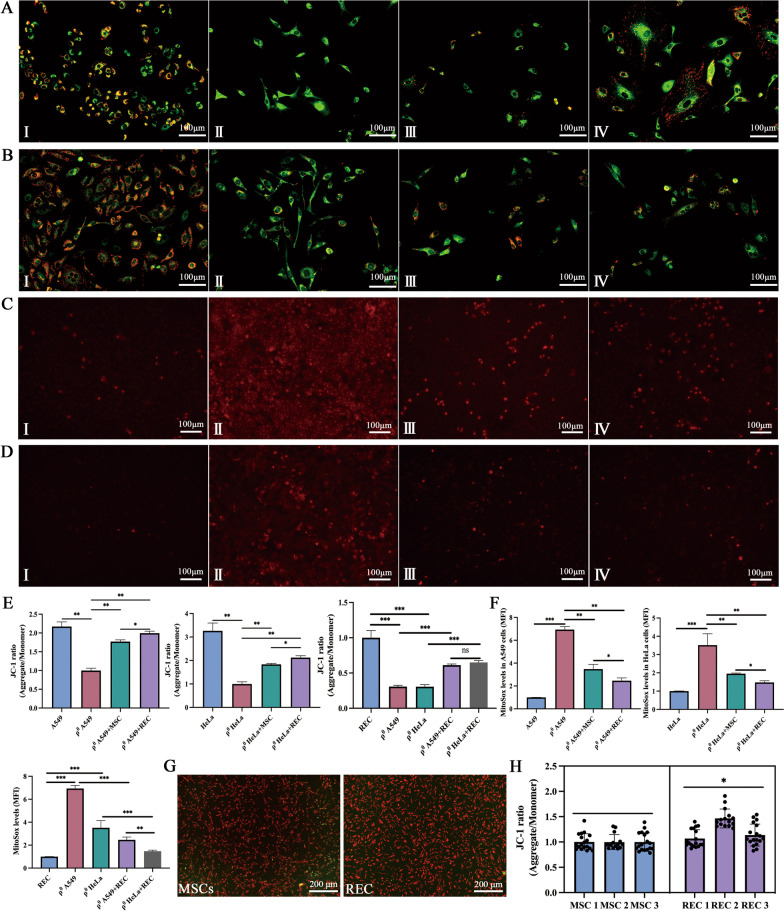
Fig. 8.
Mitochondrial function recovery of ρ0 cells after 24 h co-culture in non-contact system. A Fluorescence imaging of mitochondrial membrane potential in (I–IV) A549, ρ0 A549, ρ0 A549 + MSC, and ρ0 A549 + REC groups. B Fluorescence imaging of mitochondrial membrane potential in (I–IV) HeLa, ρ0 HeLa, ρ0 HeLa + MSC, and ρ0 HeLa + REC groups. C Representative images of Mito-Sox staining in (I–IV) A549, ρ0 A549, ρ0 A549 + MSC, and ρ0 A549 + REC groups. D Representative images of Mito-Sox staining in (I–IV) HeLa, ρ0 HeLa, ρ0 HeLa + MSC, and ρ0 HeLa + REC groups. E The flluorescence intensity ratio of mitochondrial membrane potential levels (JC-1) in different groups. F Quantitative analysis of ROS generation in different groups. G Representative fluorescence imaging of mitochondrial membrane potential in MSCs and RECs. H The fluorescence intensity ratio of mitochondrial membrane potential levels in MSCs and RECs. All co-culture groups were in a non-contact co-culture system. Data were based on three independent experiments. *p < 0.05, **p < 0.01, ***p < 0.001

