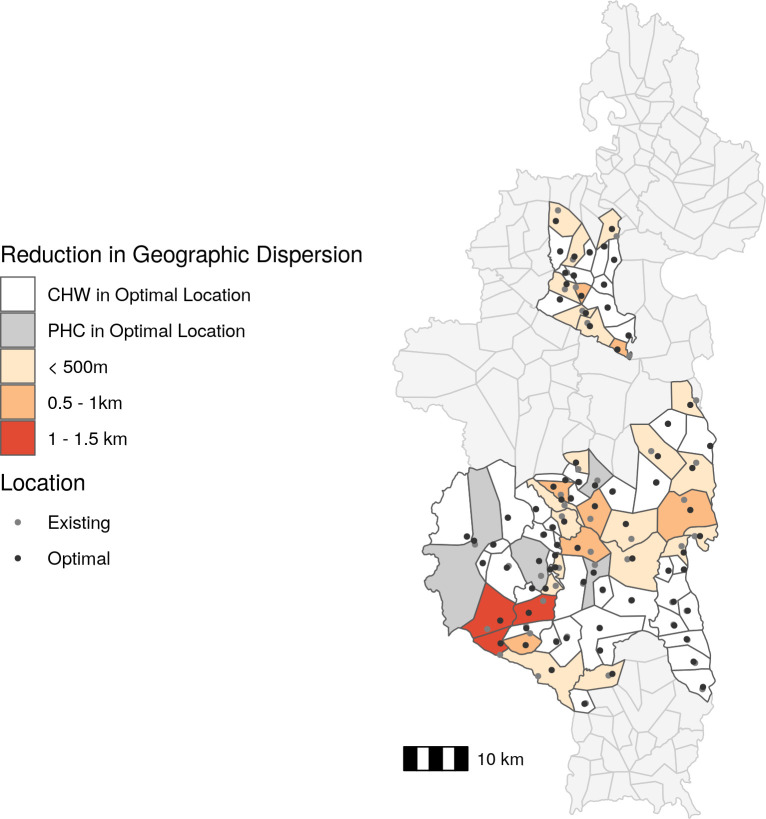
Fig 3. The majority of existing CHW sites are located near the optimal location.
Absolute change in CHW geographic dispersion based on optimal CHW site location compared to existing CHW site location. The fill color represents the reduction in geographic dispersion and points represent existing site locations (gray) and optimal site locations (black). CHW: community health worker, PHC: primary health center. Data Sources: MMoPH (administrative boundaries), Pivot (health center locations), OpenStreetMap (transportation routes, buildings). All maps have been created from spatial datasets using the R programming language.

