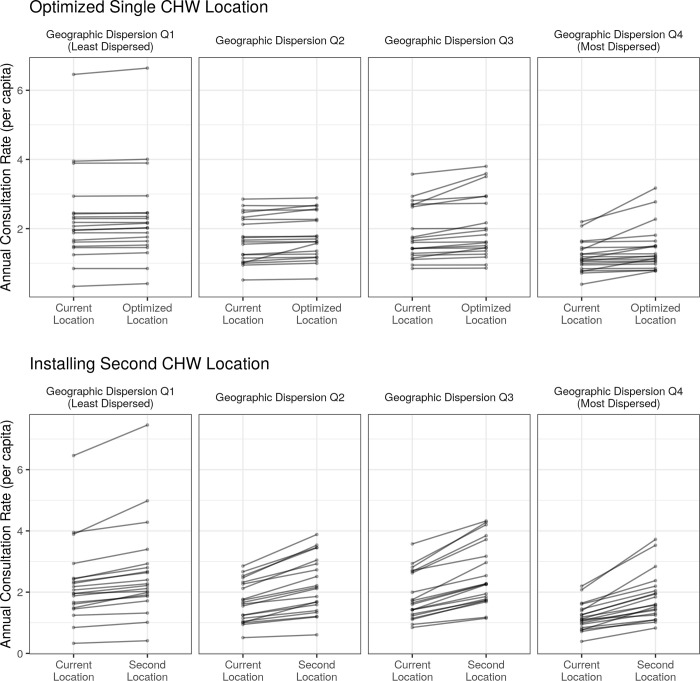
Fig 4. Both proposed solutions have the strongest predicted improvement in consultation rates in the most geographically dispersed fokontany.
The predicted change in annual CHW consultation rates following the optimization of a single CHW site (top row) or the addition of a second CHW site in an optimized location (bottom row). Each line represents the predicted change for one fokontany and fokontany are grouped into quartiles determined by their geographic dispersion estimates (Q1: least dispersed, Q4: most dispersed).

