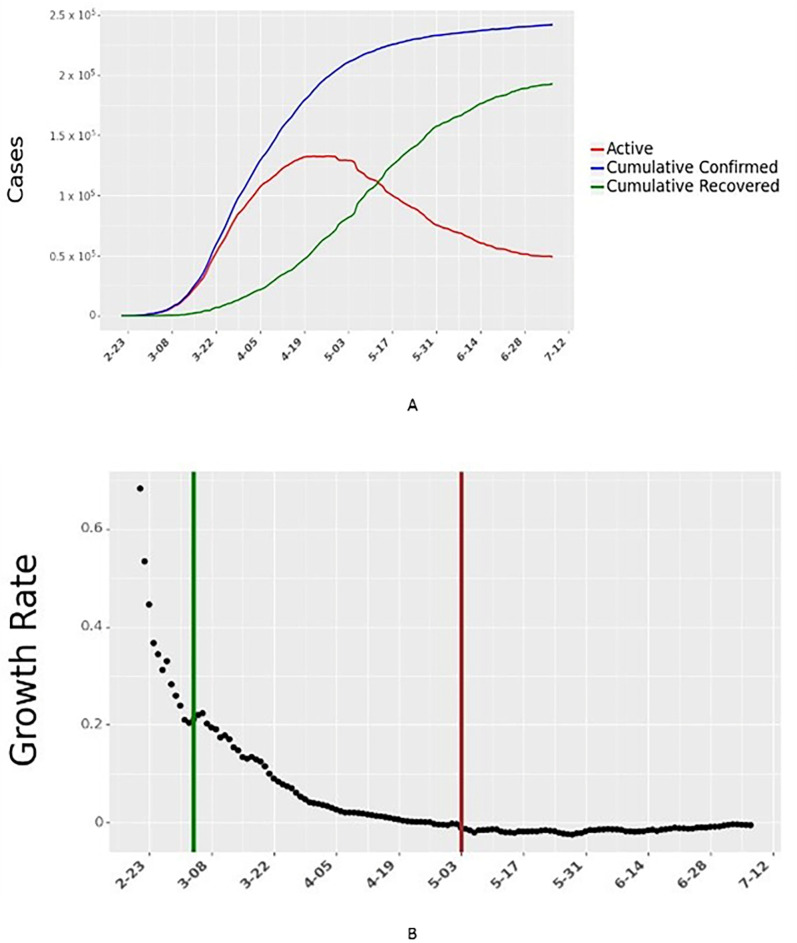
Fig 4. Daily active cases and growth rate of active cases for Italy.
The vertical green line in Fig 4B shows the start of data collection for Italy. The vertical red line in Fig 4B shows the end of 60 days of data collection for Italy. Data for all 24 countries are shown in Figs F and G in S1 Text, respectively.

