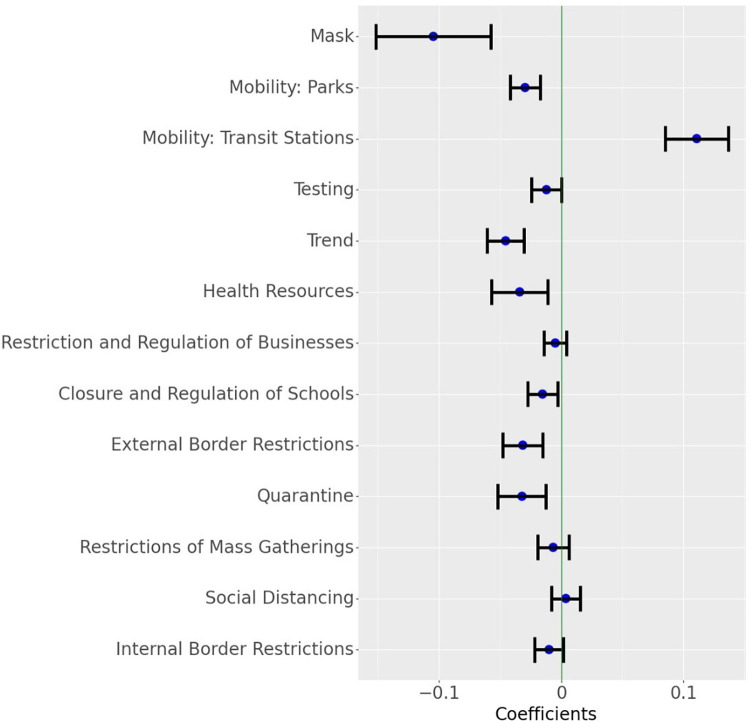
Fig 5. Parameter estimates for the growth rate model.
The blue dot indicates the point estimates and the horizontal lines indicate a 95% confidence interval around the estimate (Masks transformed as ln(1+mask)). Results for different transformations of Mask and other covariates are shown in Fig Q in S1 Text.

