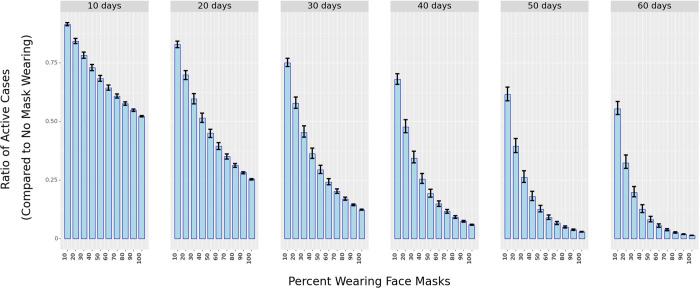
Fig 6. The ratio of active cases under different percentages of mask-wearing in public spaces as compared to 0% mask-wearing over different periods (in days).
The shaded bars represent in ratio while the black vertical lines represent the 25th and 75th percentile of the ratio (from simulations using the Krinsky-Robb method).

