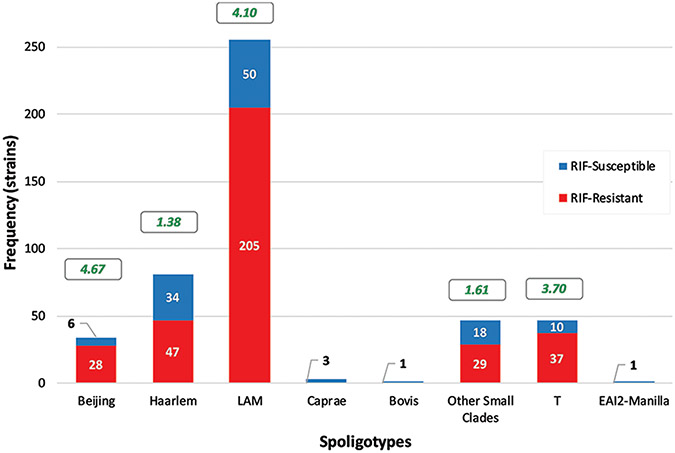
Figure 2:
Frequency histogram of the 469 strains divided by spoligotype and sorted according to susceptibility to rifampicin. Red represents resistance while blue represents susceptibility. The white numbers represent the number of strains (frequency) that belong to certain spoligotypes and are susceptible/resistant to rifampicin. Black numbers have been added for contrast purposes but serve the same role. Green numbers in boxes represent the ratio of rifampicin resistant/rifampicin susceptible strains of each spoligotype

