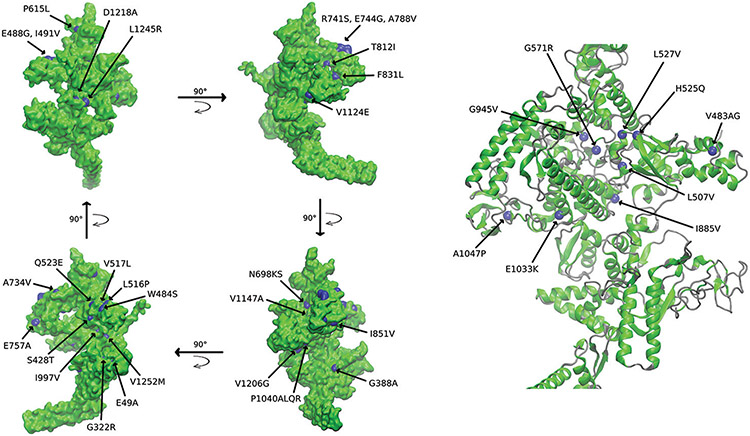
Figure 5:
Crystal of the Mycobacterium tuberculosis β’ subunit (rpoC), represented according to its surface and its secondary structure. The surface, β sheets, and α helices are shown in green, while loops are colored gray. The mutations found in our study are either pictured in blue patches (surface) or as Van der Waals spheres (alpha carbon of buried residues only, radius scale = 1.4 Å). The arrows in the left panel indicate the direction of the rotation of the protein along the Y axis

