Figure 7:
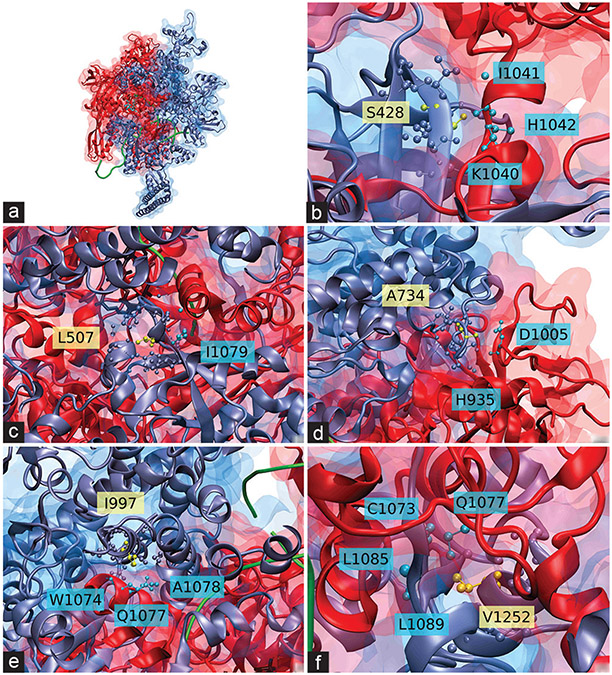
Crystal structure of Mycobacterium tuberculosis transcription complex showing interaction of β’ (rpoC) and β (rpoB) subunits. Proteins are represented by their secondary structure and their surface; rpoC is shown in iceblue and rpoB is shown in red. Two DNA strands are shown in green as a ribbon, along with a rifampin molecule in light blue (panel a) or black (panels b– f). rpoC residues whose sites would carry compensatory mutations are marked in yellow in Corey-Pauling-Koltun model (CPK) representation (side chain included). rpoB residues within 5.00 Å (6.00 Å for panel c) of the marked rpoC residues are shown in cyan in CPK representation. rpoC residues within that distance are shown in iceblue in CPK representation, (a) Provides a full, general view of the interaction between the subunits, while the rest of the panels show the putative rpoC compensatory mutations interacting with close residues in rpoB: S428T (b), L507V (c), A734V (d), I997V (e), V1252 LM (f). The amino acids are indicated according to standard code, according to the subunit they belong (yellow for rpoC, blue for rpoB)

