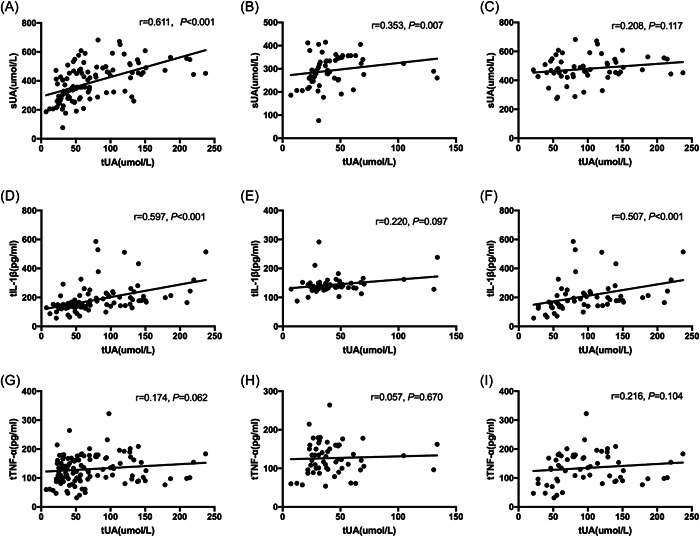
Figure 2.

Spearman correlations between tear uric acid and serum uric acid, tear IL‐1β or tear TNF‐α concentrations. Correlation between tear uric acid and serum uric acid of total population (A), control group (B) or HUA group (C). Correlation between tear uric acid and tear IL‐1β of total population (D), control group (E) or HUA group (F). Correlation between tear uric acid and tear TNF‐α of total population (G), control group (H), or HUA group (I). HUA, hyperuricemia; IL‐1β, interleukin‐1beta; TNF‐α, tear tumor necrosis factor‐α.
