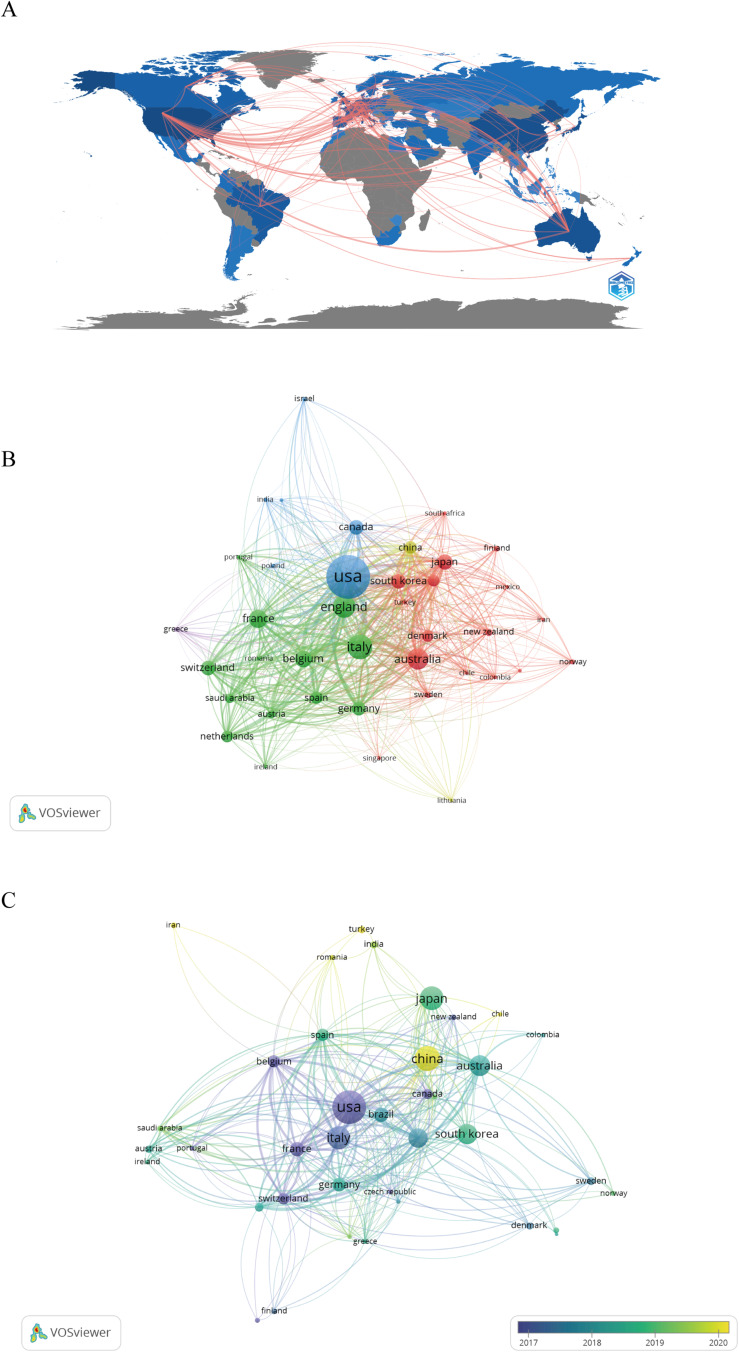
Figure 3.
The analysis of countries. (A) Heat map showing the distribution and cooperation in the world. (B) Citation of countries, the size of the nodes represents the number of citations. (C) Number of national publications. The size of nodes is determined by the publication numbers. The color indicates the average appearing year.

