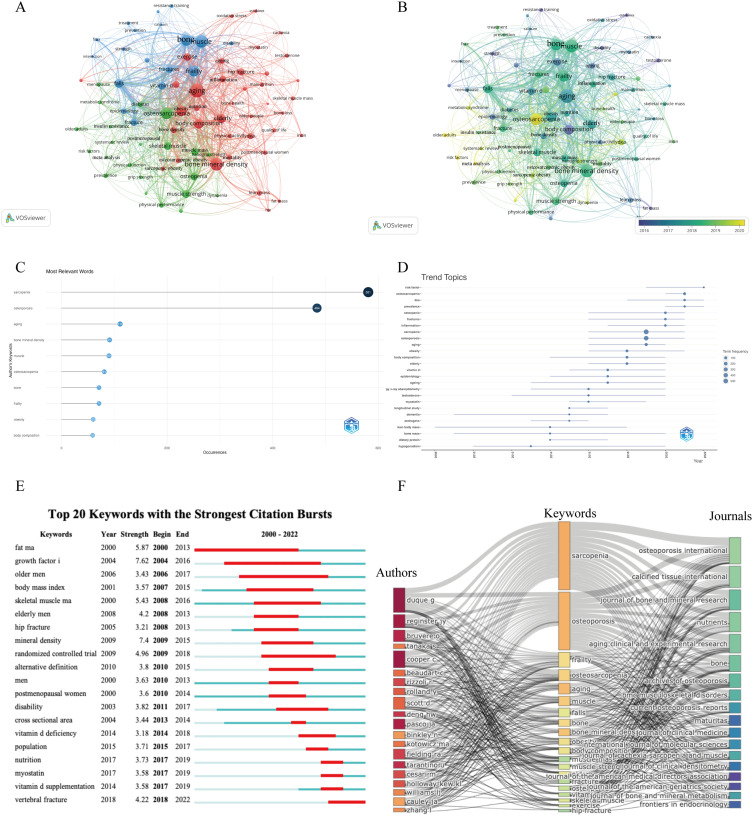
Figure 8.
The analysis of keywords. (A and B) Network visualization of the keywords co-occurrence analysis. The size of the nodes represents frequency. The color indicates the average appearing year in (B). (C) The frequency of the top 10 keywords. (D) The trend topics based on keywords generated by R package Bibliometric. (E) Top 20 keywords with strongest citation bursts between 2000 to 2022; the red bars represent the duration of bursts. (F) Three-field graphs of authors, keywords, and journals.

