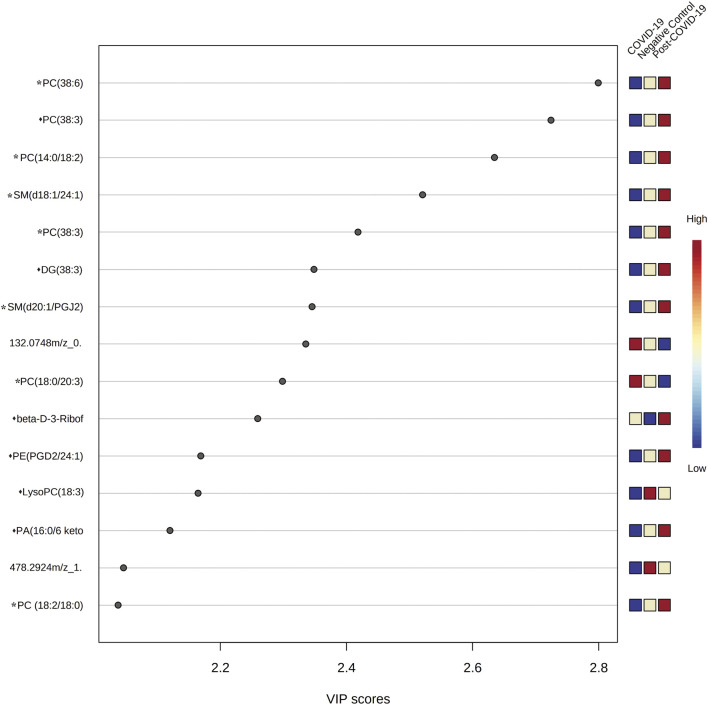
FIGURE 6.
Variable importance in Projection (VIP) plot representing the rank of 15 features identified by PLS-DA according to VIP score on x-axis. The most discriminating metabolites are shown in descending score order. The color boxes indicate whether metabolite concentration was increased (red) or decreased (blue). Figures were produced in MetaboAnalyst software v 5.0 (https://www.metaboanalyst.ca/). * Represents features with confidence level 2 and ♦ represents features with level 3.

