
Fig. 2 |. Behavioural landscape of intravascular inflammation.
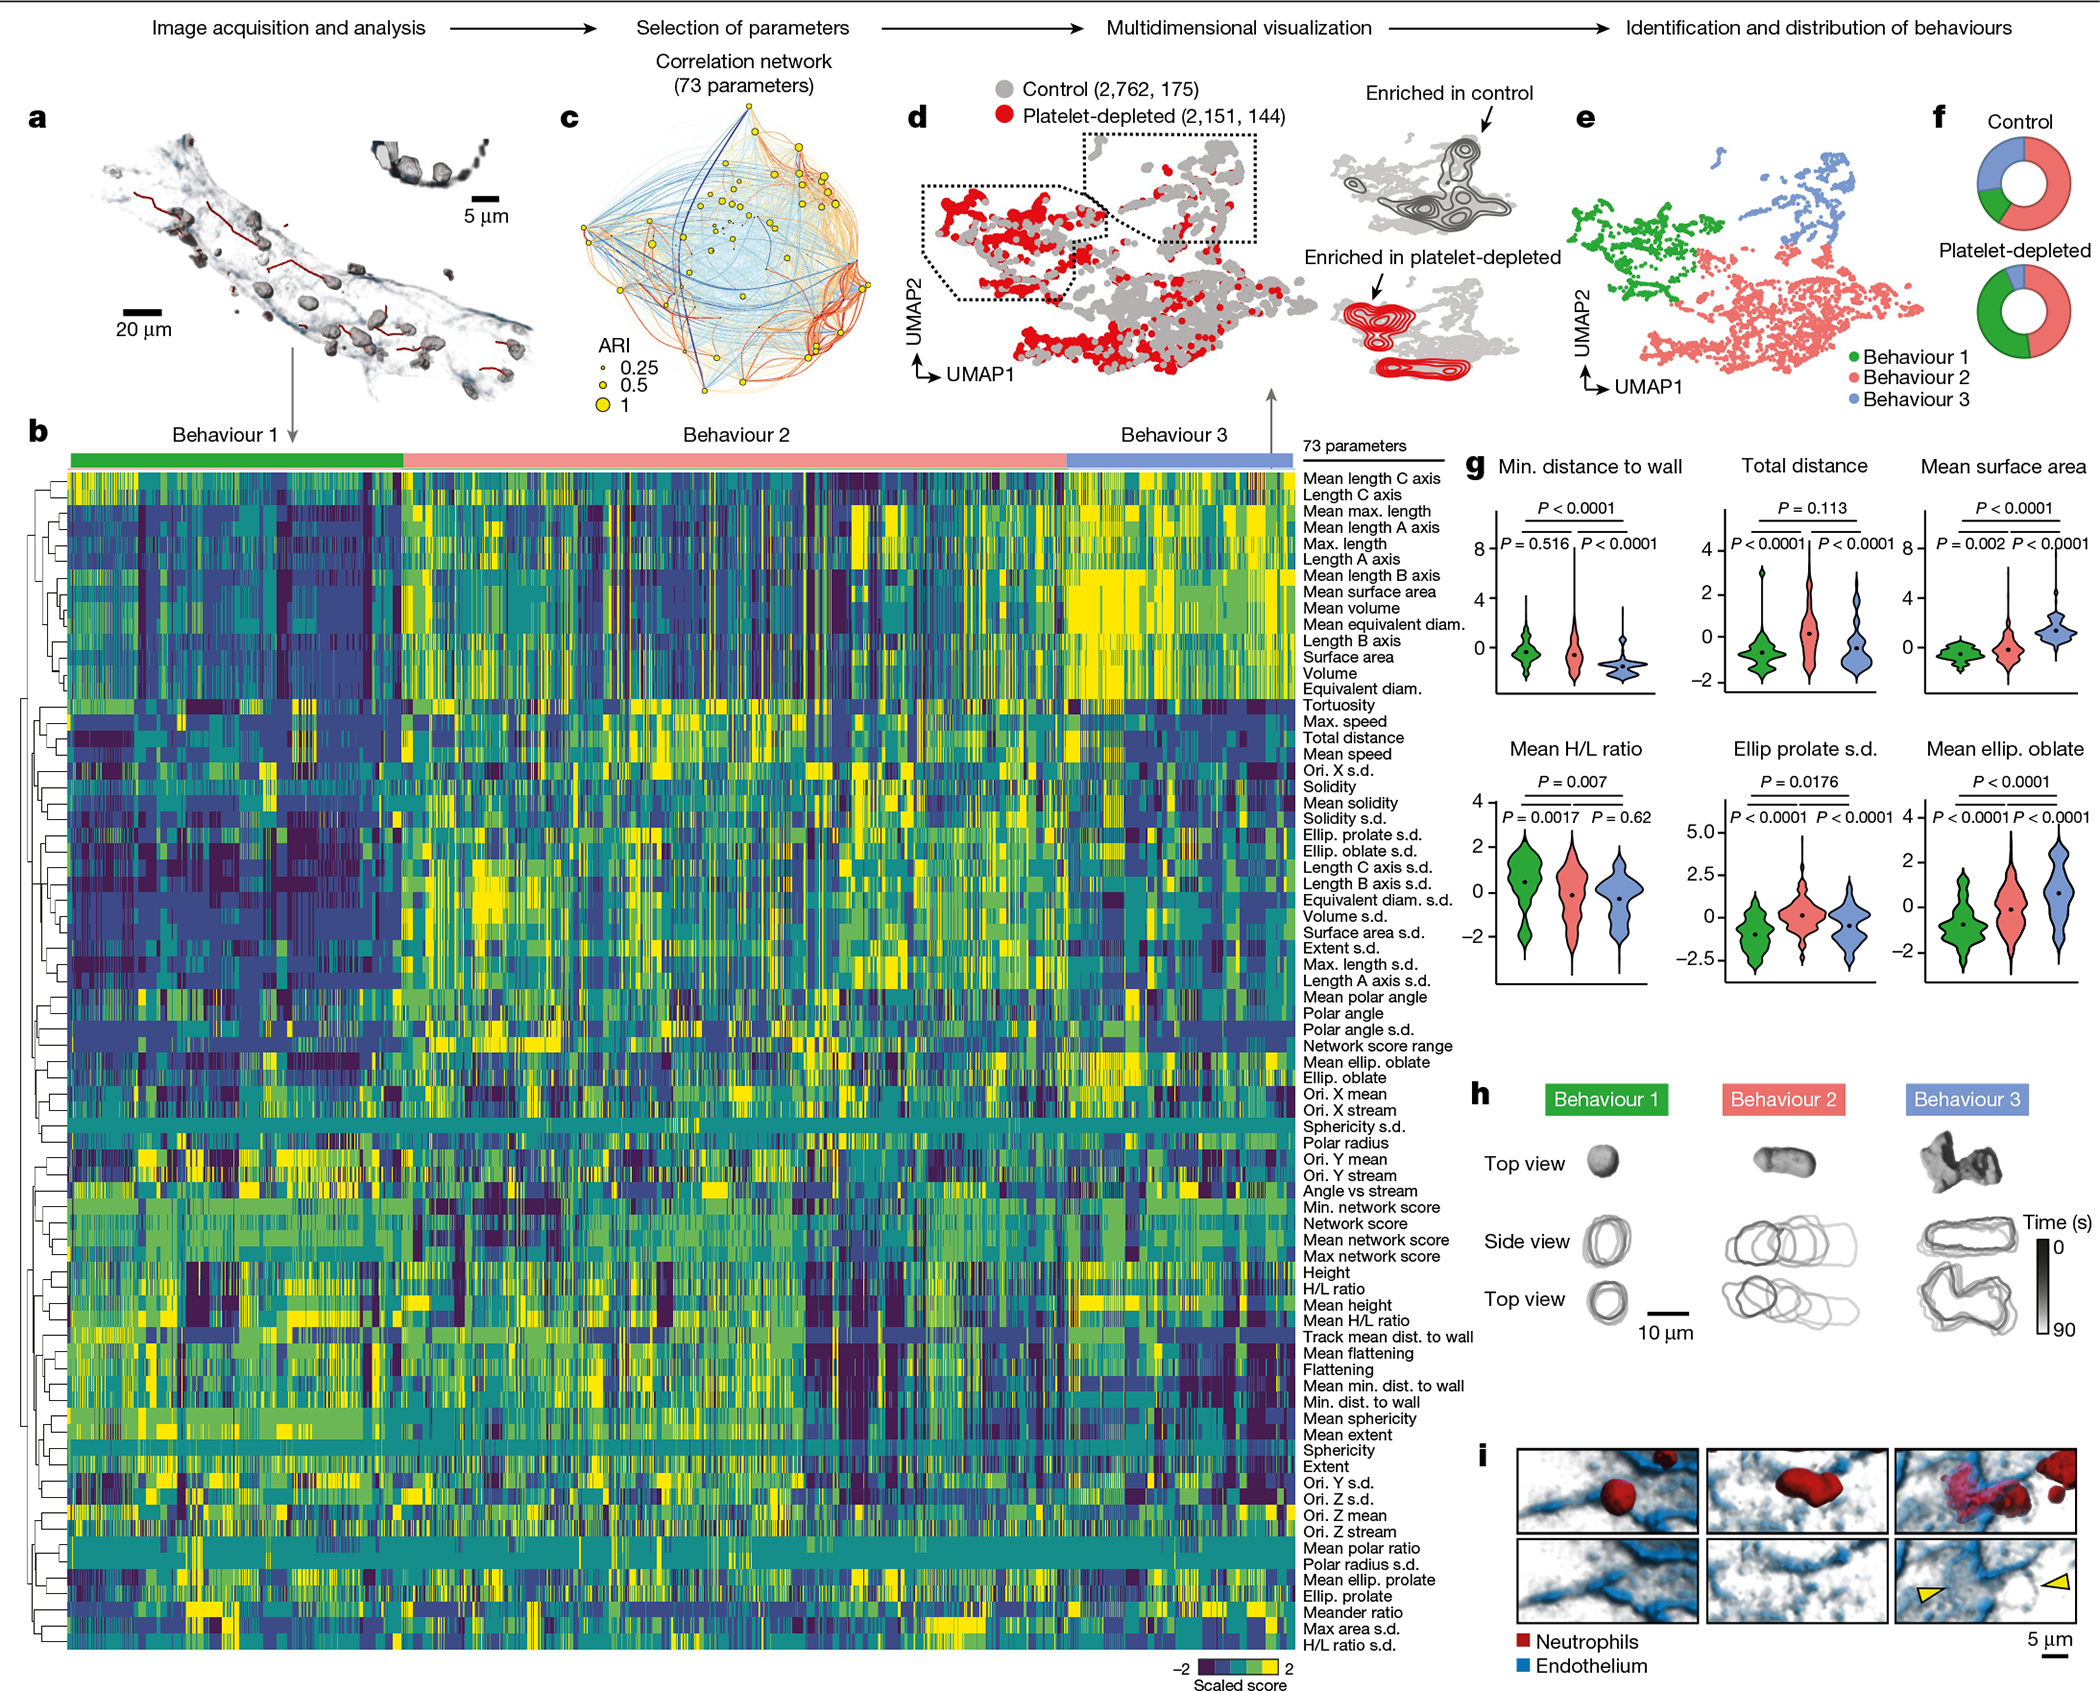
a, Representative 3D and track reconstructions of leukocytes inside an inflamed venule. Inset shows a cross-section of the same vessel. b, Heat map of the dataset obtained for neutrophils inside inflamed venules and all 73 morpho-kinetic parameters, distributed for the three identified behavioural profiles (behaviours 1–3). c, Correlation network of the dataset, showing parameters as nodes (circles) whose diameters are proportional to their adjusted Rand index (ARI), with lines connecting pairs of parameters coloured according to positive (red) and negative (blue) correlations. The thicknesses of the links are proportional to the Pearson correlation coefficient for each pair. d, t-SNE representation of 4,913 temporal cell reconstructions (319 cells) from control and platelet-depleted mice. Density plots at right show the differential distribution of events for each group. Data are from at least four mice per group. e, f, Uniform manifold approximation and projection (UMAP) plot showing the three distinct behavioural clusters (labelled with colours) (e), and the distribution of cells in each cluster for the control and platelet-depleted groups (f). g, Violin plots for the indicated parameters across the three behavioural groups. Data were analysed using univariate multinomial model. h, Volumetric reconstruction of representative cells from behavioural clusters 1–3 (top) and temporal outlines (bottom). i, 3D reconstruction of the same cells shown in h, showing an endothelial footprint (arrowheads) only for the B3 cell. Diam., diameter; Dist., distance; Max., maximum; Min., minimum; Ellip., ellipticity; ori., orientation.