
Fig. 4 |. Behavioural reprogramming protects from inflammation.
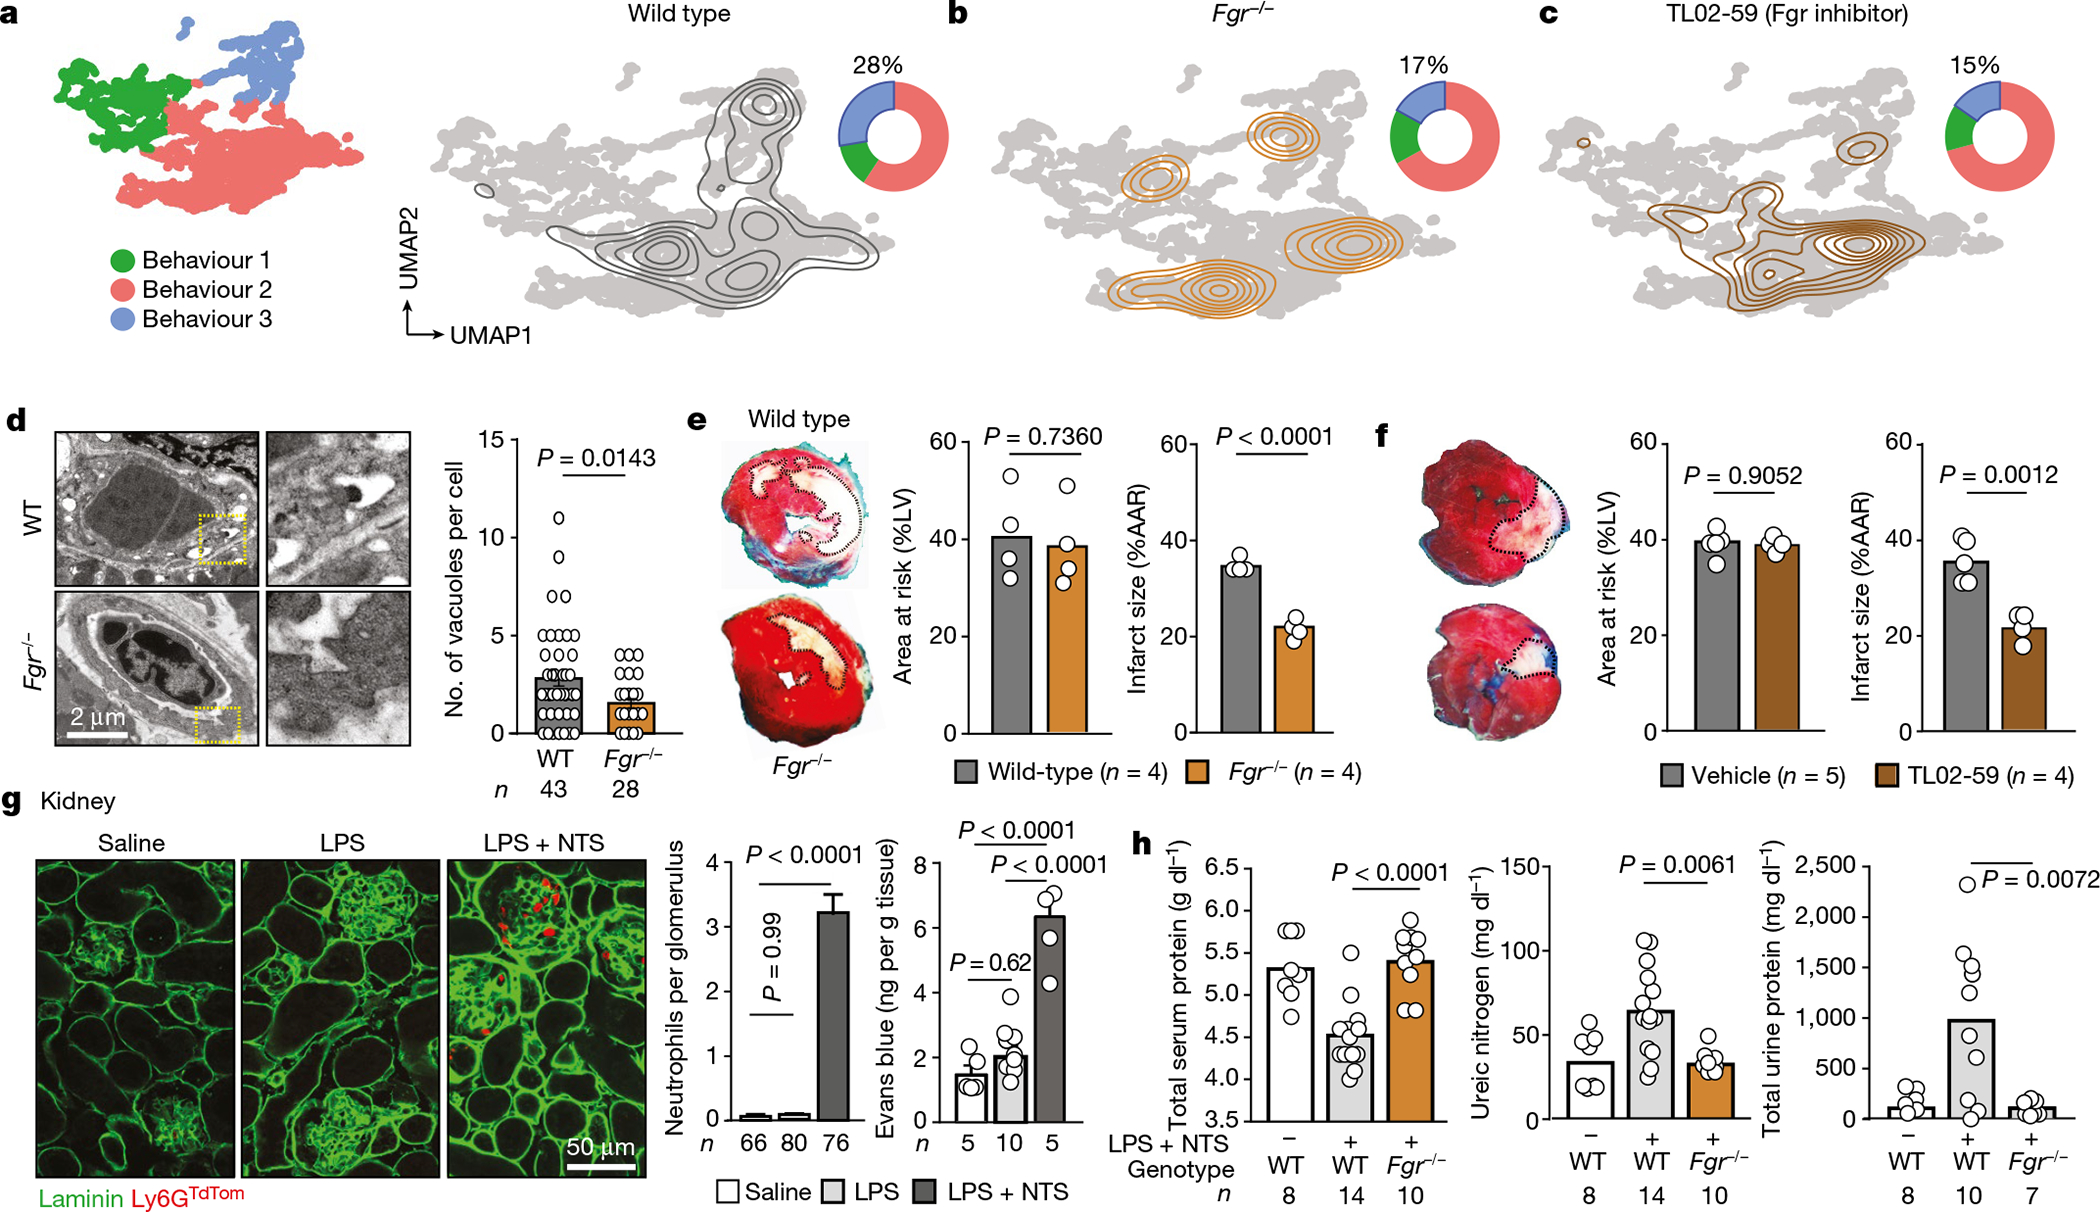
a, UMAP plot showing the distribution of the three behavioural groups (left), density plot for the wild-type control group layered over the global UMAP plot (right) and doughnut plot showing the distribution of cells among the three behavioural clusters. b, c, Similar UMAP and doughnut plots to those in a were built for mice reconstituted with Fgr−/− bone marrow (b) or treated with the Fgr inhibitor TL02–59 (c). Note the shift of cells away from B3 after interfering with Fgr. Numbers in doughnut plots indicate the percentage of cells in B3. d, Vascular damage during myocardial ischaemia–reperfusion determined by vacuolation of endothelial cells in hearts, from images obtained by transmission electron micrographs and quantified right; n is the number of vascular sections analysed. e, f, Protection from myocardial injury in Fgr−/− mice (e) or wild-type mice treated with the inhibitor TL02–59 (f) after normalization to the areas at risk. The dead myocardial area is outlined in white in the heart sections; n is the number of mice analysed. g, Glomerulonephritis model. Left, immunofluorescence of kidney tissue showing accumulation of neutrophils in glomeruli after injury induced by lipopolysaccharide (LPS) and nephrotoxic serum (NTS). Right, quantification of neutrophils accumulated per glomerulus; n is the number glomeruli analysed. Data are mean ± s.e.m. Right, vascular damage measured by Evans blue extravasation; n is the number of mice. h, Analysis of serum and urine in control and glomerulonephritis-induced wild-type and Fgr−/− reconstituted mice. All data are means and were analysed by two-tailed unpaired t-test (d–f), or one-way ANOVA with Tukey’s multiple comparison test (g, h). The number of replicates per group (n) is indicated in each panel.