
Extended Data Fig. 4 |. Behavioral landscape of laser injury in the skin.
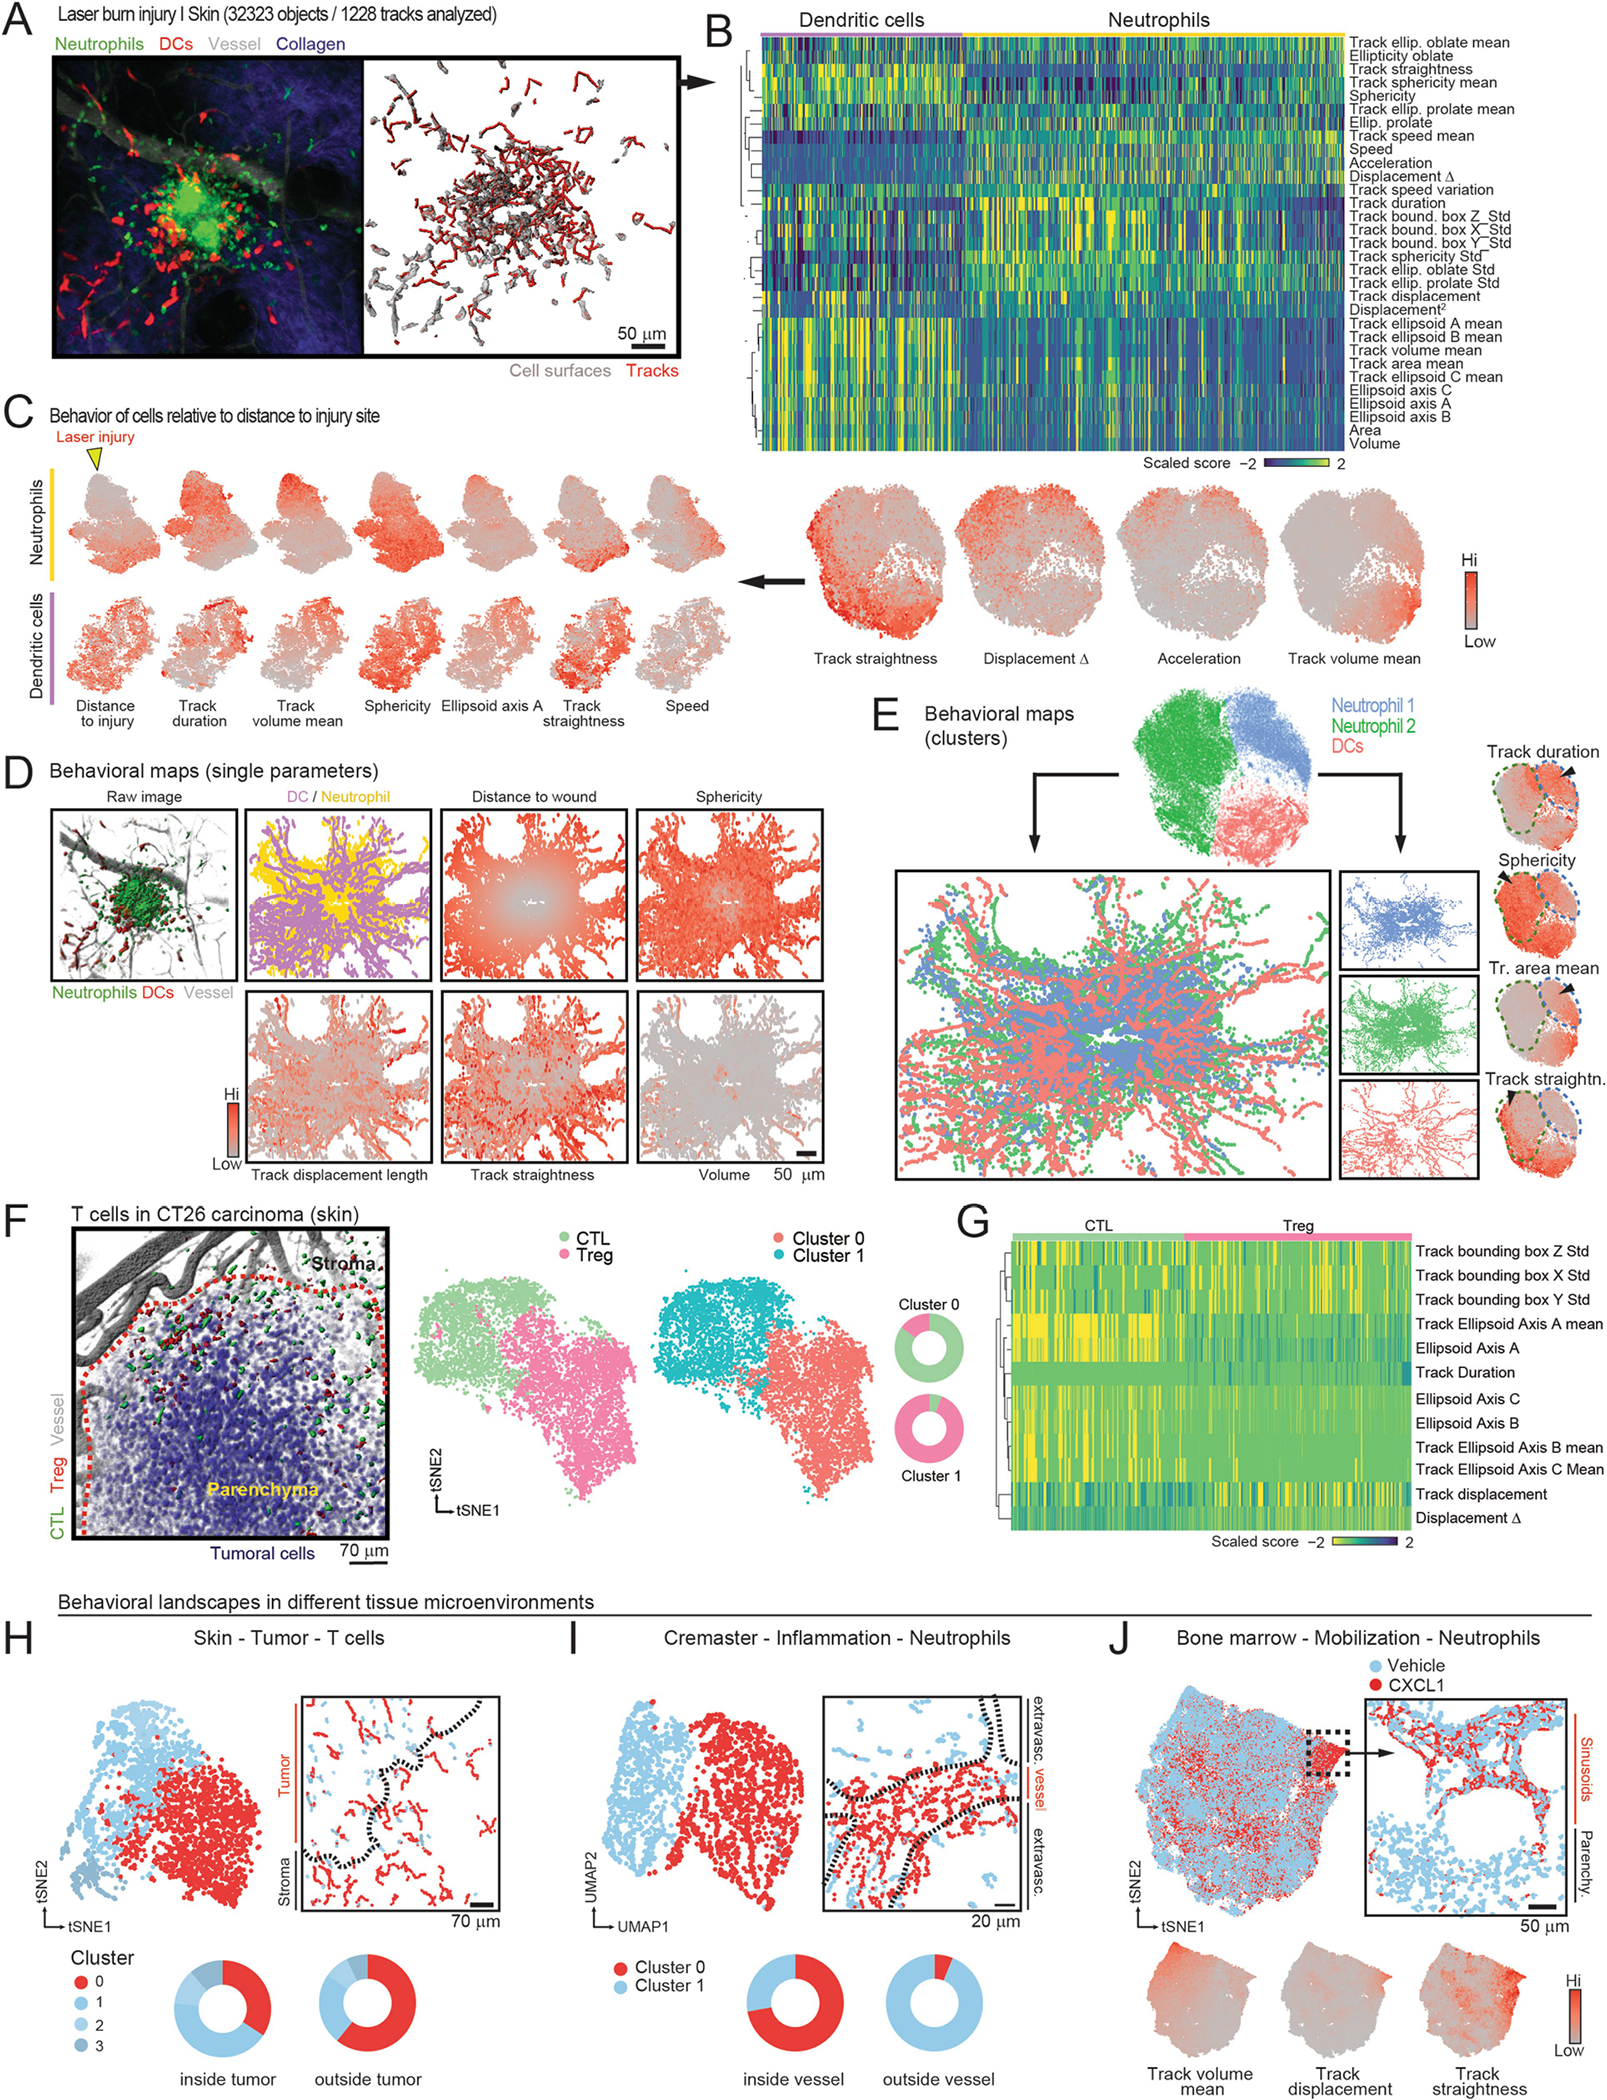
(A) Representative image of laser burn injury (original image left; reconstruction of volumes and tracks at right), (B) Heatmap of the all scored parameters, showing DCs and neutrophils. Expression tSNE plots of selected parameters are shown at bottom. (C) Individual analyses of the behavior of DCs and neutrophils from the original dataset, shown as tSNE plots for each population. Each behavioral parameter can be visualized and compared across cell subsets and parameters to infer random or gradient distribution for each population. For example, the location of the laser injury can be extracted as a parameter (left, yellow arrowhead) that shows graded behaviors of neutrophils relative to their distance to the wound, but not for DCs. (D) Examples of behavioral maps generated by projecting the intensity of specific parameters onto the XY location of individual cells at all time points. Actual image, plot-map by cell type and behavioral maps are shown. (E) Sub-clustering identifies two behavioral clusters of neutrophils and one for DCs (top), which were projected back onto their corresponding xyz position thus giving a profile of the distribution of behavioral clusters in the skin anatomy (middle). The neutrophil clusters feature differences in various parameters, as shown in the expression plots (arrowheads in the bottom tSNE plots). (F) Representative image of regulatory T cells (Treg) and cytotoxic T cells (CTL) in a CT26 carcinoma (red outline) in the skin, and tSNE plots of the cells classified by behavioral phenotype and by cell type. Donut plots show the match between both classifications. (G) Heatmap of the differentially scored parameters discriminating CTLs and Tregs. (H–J) Behavioral landscapes and maps of CTLs in carcinoma-bearing mice (H), neutrophils inside or outside inflamed vessels (I), and bone marrow neutrophils before and after administration of the mobilizing chemokine CXCL1 (J). Donut plots and expression plots illustrate the correlation between behavioral patterns or parameters and their localization in tissues. Dashed lines in the behavioral maps in (H–I) delineate tumor-stroma or vessel-parenchyma borders, respectively. Data are from one experiment per condition to visualize the distribution of cells in a single anatomical area.