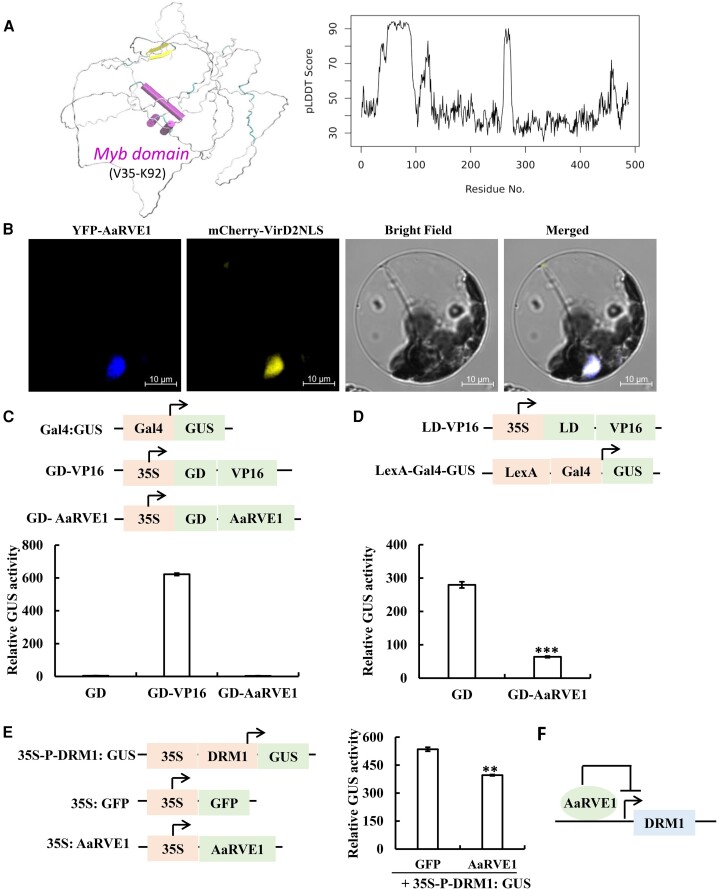
Figure 5.
The MYB transcription factor AaRVE1 functions as a transcription repressor and regulates the expression of DORMANCY-ASSOCIATED PROTEIN 1 (DRM1) promoter. A, Protein structure modeling of AaRVE1 using AlphaFold2. AaRVE1 has a folded MYB domain surrounded by IDPRs. The predicted structure with the best overall predicted local distance differences test (pLDDT) score was shown. Purple cylinders are helices of the MYB domain. A beta-hairpin (yellow) is predicted with relatively high pLDDT scores. Except for the two folded regions (Myb domain and beta-hairpin), the rest part of the protein is disordered (white: coils; cyan: turns). B, AaRVE1 colocalizes with the nuclear marker VirD2NLS in Populus protoplasts. YFP: yellow fluorescent protein. C, AaRVE1 has no activator activity. AaRVE1 was fused with Gal4 binding domain (GD) and its activation on the reporter (Gal4:GUS) was measured in Populus protoplasts. GD only was used as the negative control. Transactivator GD-VP16 was used as the positive control. The 35S:Luciferase construct was co-transfected in each reaction to normalize and calculate the relative GUS activity. n = 3. D, AaRVE1 has repressor activity. The repression of GD-AaRVE1 on the reporter (activated LexA-Gal4:GUS by LD-VP16) was measured in protoplasts. For LD-VP16, the transcriptional activator VP16 was fused with LexA binding domain (LD). GD only was used as the negative control. 35S:Luciferase construct was co-transfected in each reaction to normalize and calculate the relative GUS activity. n = 3. E and F, AaRVE1 represses the expression of DORMANCY-ASSOCIATED PROTEIN 1 (DRM1) promoter in protoplasts. In the reporter construct 35S-P-DRM1:GUS, the DRM1 promoter region was cloned downstream of the CaMV 35S promoter and upstream of the GUS reporter gene. The reporter construct 35S-P-DRM1:GUS was paired with the 35S:GFP (negative control) or 35S:AaRVE1 construct. The paired plasmids were co-transfected into Populus protoplasts. n = 3. Data are presented as mean ± Sd. Statistical significance was determined using two-tailed Student's t-test. “**” and “***” indicate a significant difference at P < 0.01 and P < 0.001, respectively. All the statistical analysis in the figure were performed using the same method.

