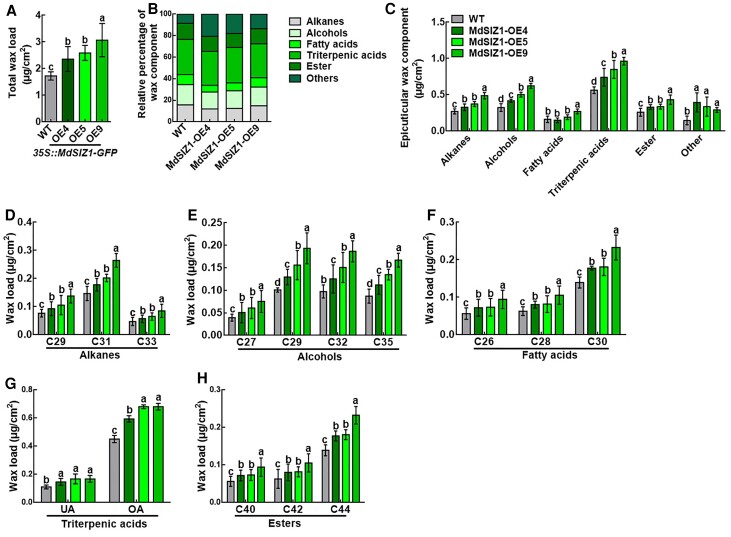
Figure 2.
Cuticular wax composition in WT and MdSIZ1-OE apple leaves. A, Total wax load, (B) Relative percentage of wax component, (C) Composition of cuticular waxes, (D) Total alkane load, (E) Total alcohol load, (F) Total fatty acid load, (G) Total triterpenic acid load, UA: ursolic acid; OA: oleanolic acid, and (H) Total ester load. Wax coverage is expressed as μg cm−2 leaf surface area. Each wax constituent is designated by the carbon chain length and is labeled by chemical class along the x-axis. Error bars indicate standard deviation (Sd; n = 3). Different letters indicate significant differences (ANOVA, Student's t test; P < 0.05).

