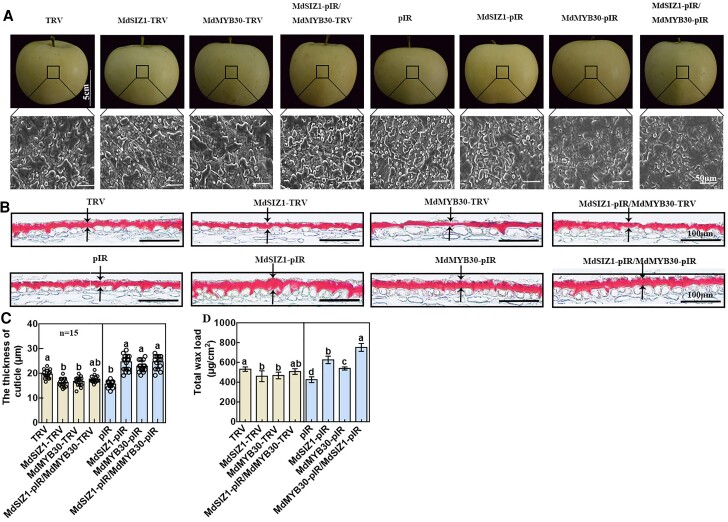
Figure 6.
Wax deposition in virus-induced transgenic apple fruits. A, SEM images of apple epicuticular wax crystals in apple fruits. Scale bar, 5 cm/50 μm. B, Light microscopy showing the cuticle in apple fruits indicated by Oil Red Ostaining. Scale bar, 100 μm. Black arrows indicate the cuticle sections measured via ImageJ. C, The cutinization of the epidermal cell wall of apple fruits indicated by Oil Red O staining measured via ImageJ. Error bars indicate standard deviation (Sd; n = 15). Different letters indicate significant differences (ANOVA, Student's t test; P < 0.05). D, The total wax load of apple fruits. Error bars indicate standard deviation (Sd; n = 3). Different letters indicate significant differences (ANOVA, Student's t test; P < 0.05).

