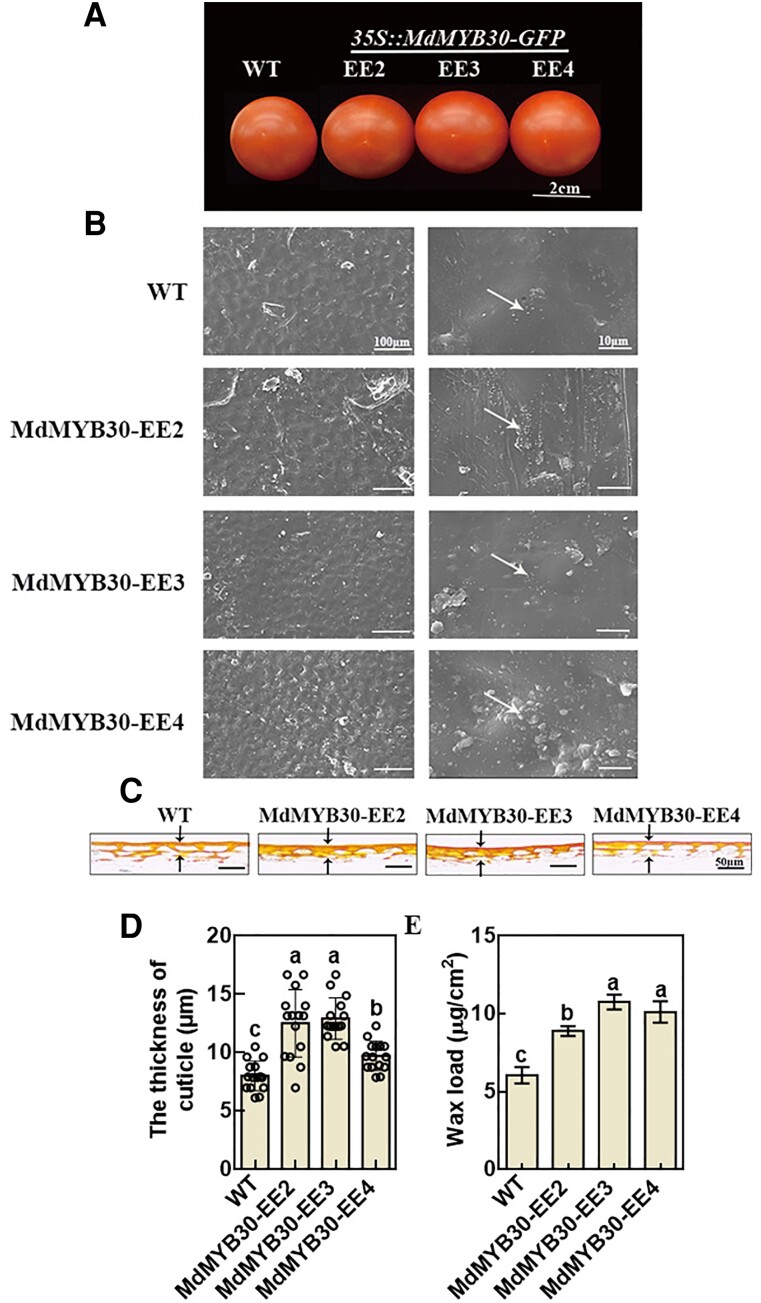
Figure 8.
MdMYB30 increased cuticle accumulation in tomato fruits. A, Phenotypes of WT and MdMYB30-EE tomato fruits. Scale bar, 2 cm. B, SEM images of cuticular wax crystals on tomato fruits. Bars, 100/10 µm. White arrows indicate the typical shapes of epicuticular wax crystals (ellipse). C, The cuticle of the epidermal cell wall of tomato fruits by Oil Red O staining. D, The cuticle thickness of tomato fruits by Oil Red O staining. Error bars represent standard deviation (Sd; n = 15). Different letters indicate significant differences (ANOVA, Student's t test; P < 0.05). E, Total wax load of tomato fruits in the red ripe stage. Error bars indicate standard deviation (Sd; n = 3). Different letters indicate significant differences (ANOVA, Student's t test; P < 0.05).

