
Figure 2 |. Classification of STK11 loss (mutant) patient tumors into positive, NE, and negative subsets.
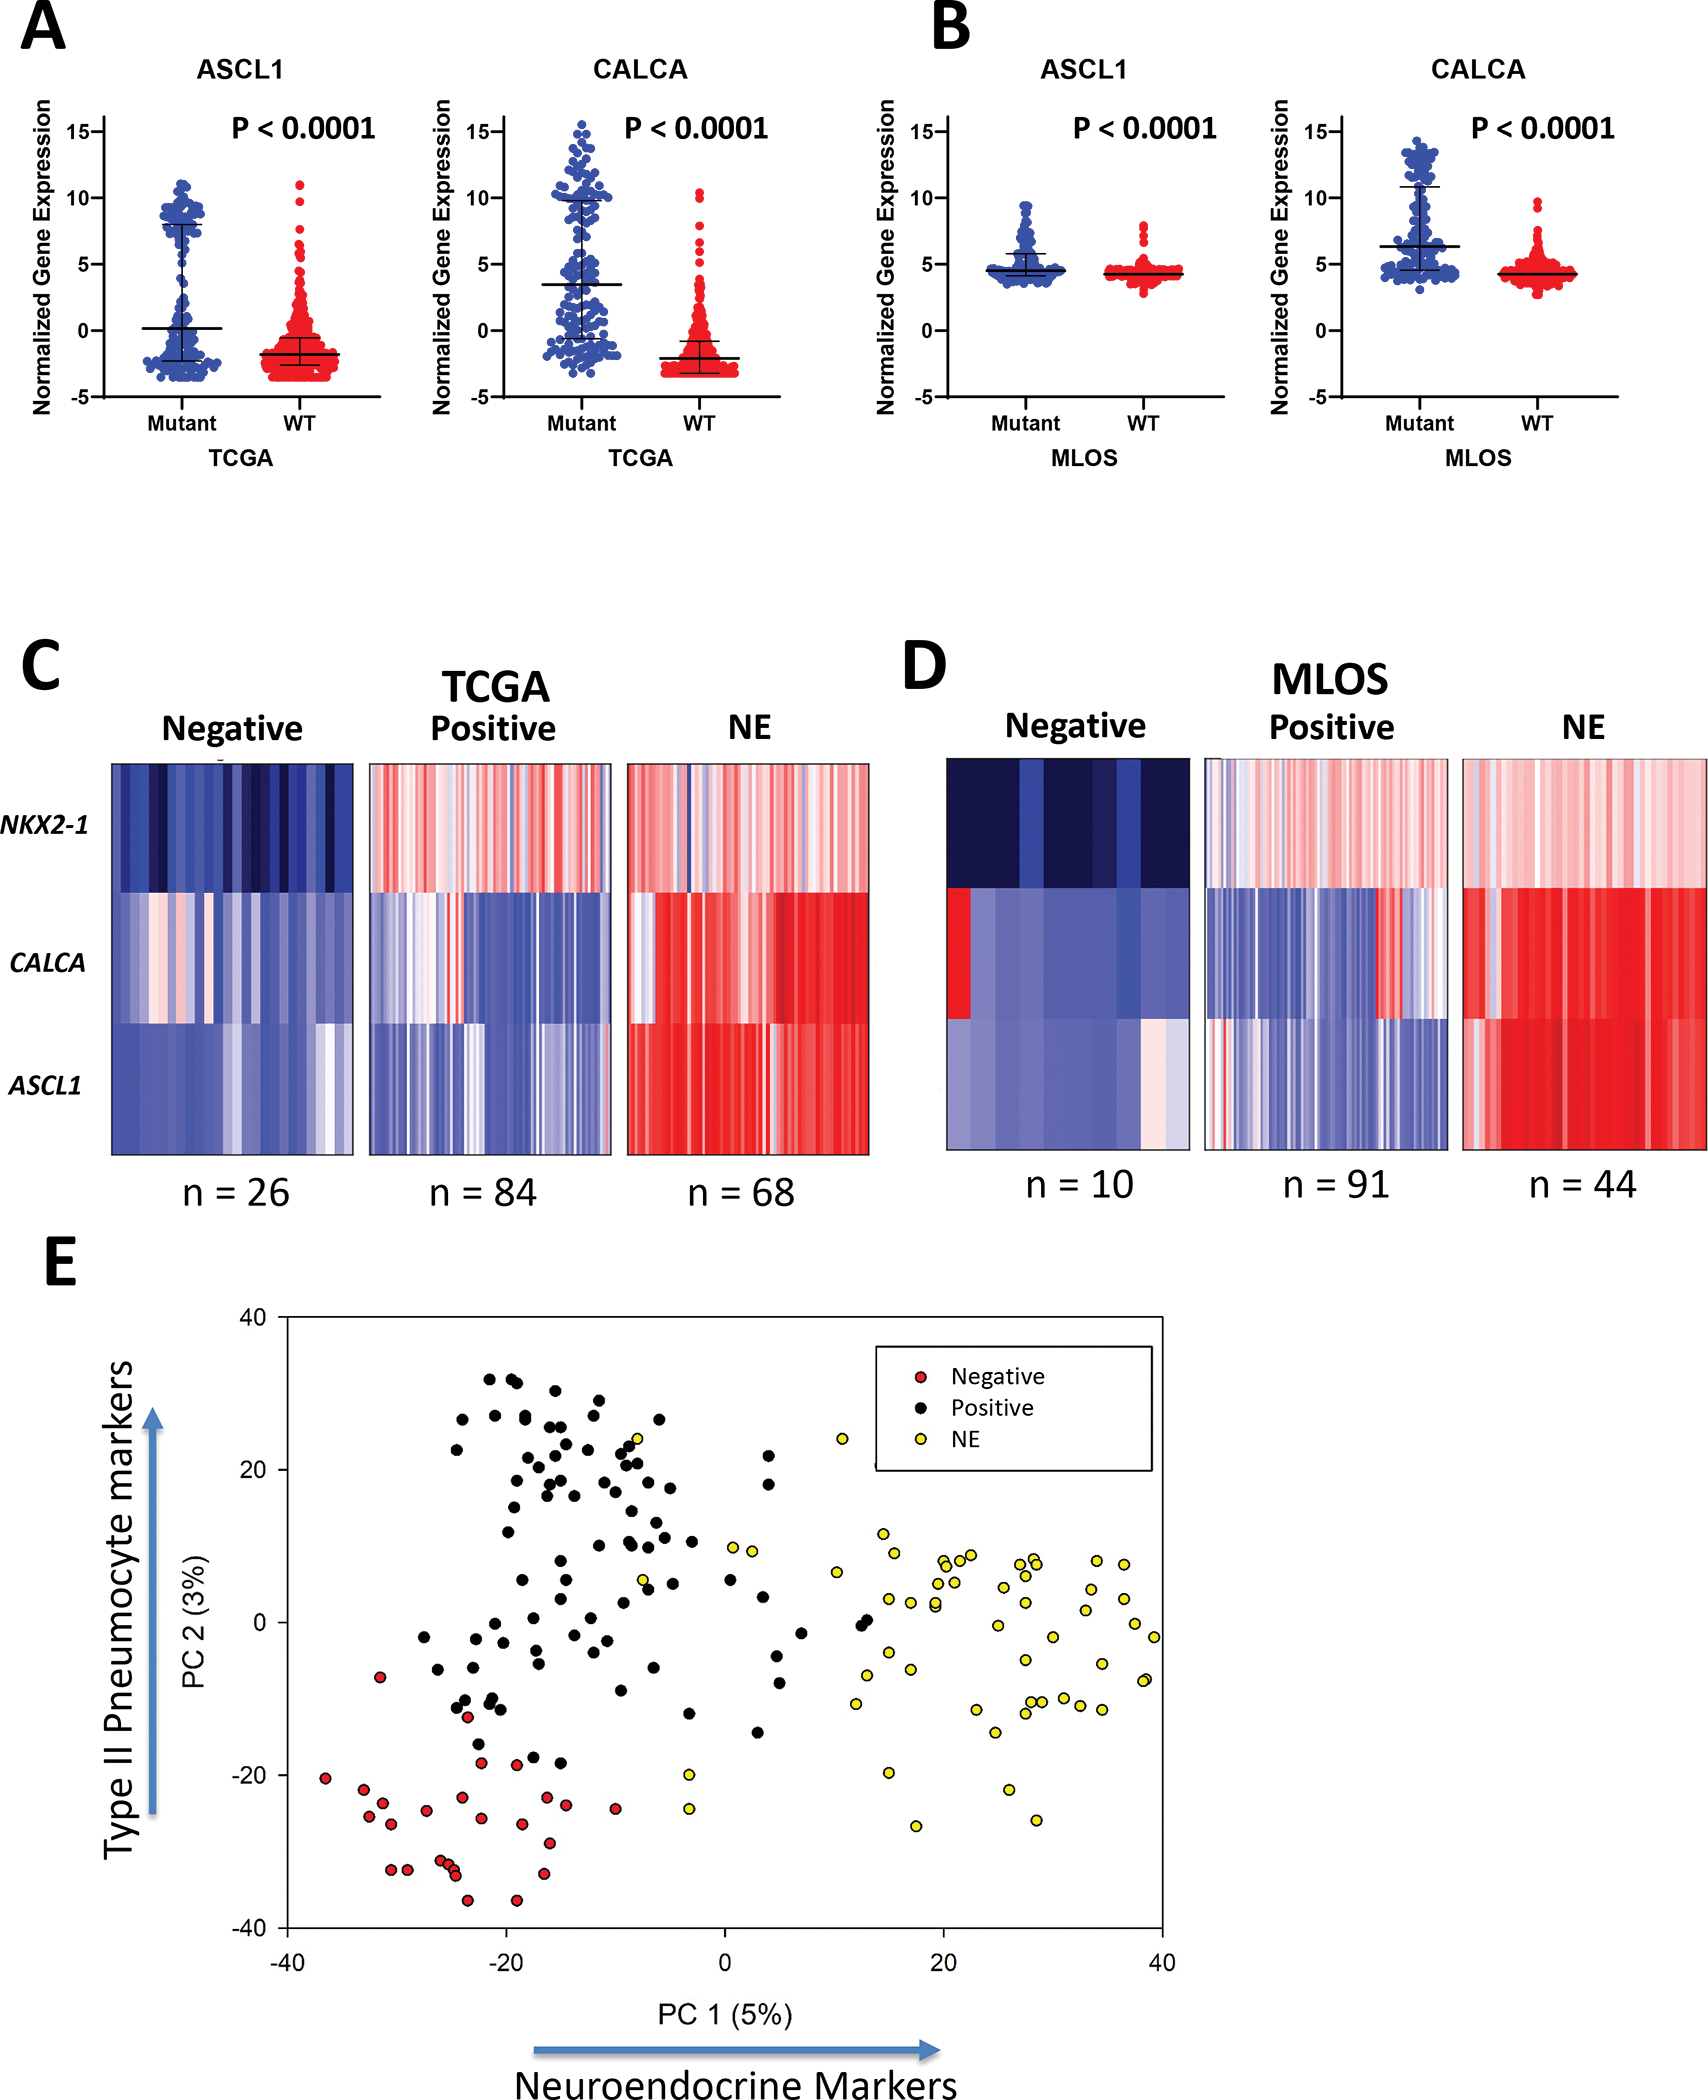
(a) Gene expression of neuroendocrine markers ASCL1 and CALCA in STK11 normal and STK11 loss in TCGA (left) and MLOS (right). (b-c) K-means clustering of STK11 loss patients in TCGA (b) and MLOS (c) into negative, positive, and NE subsets based on the markers NKX2-1, ASCL1, and CALCA. (d) Scatter plot of PC-1(neuroendocrine signature) and PC-2 (differentiation signature) of principal component analysis performed on 544 genes describing variance of STK11-loss subtypes.