
Figure 3 |. Molecular and clinical characterization of STK11 loss subsets.
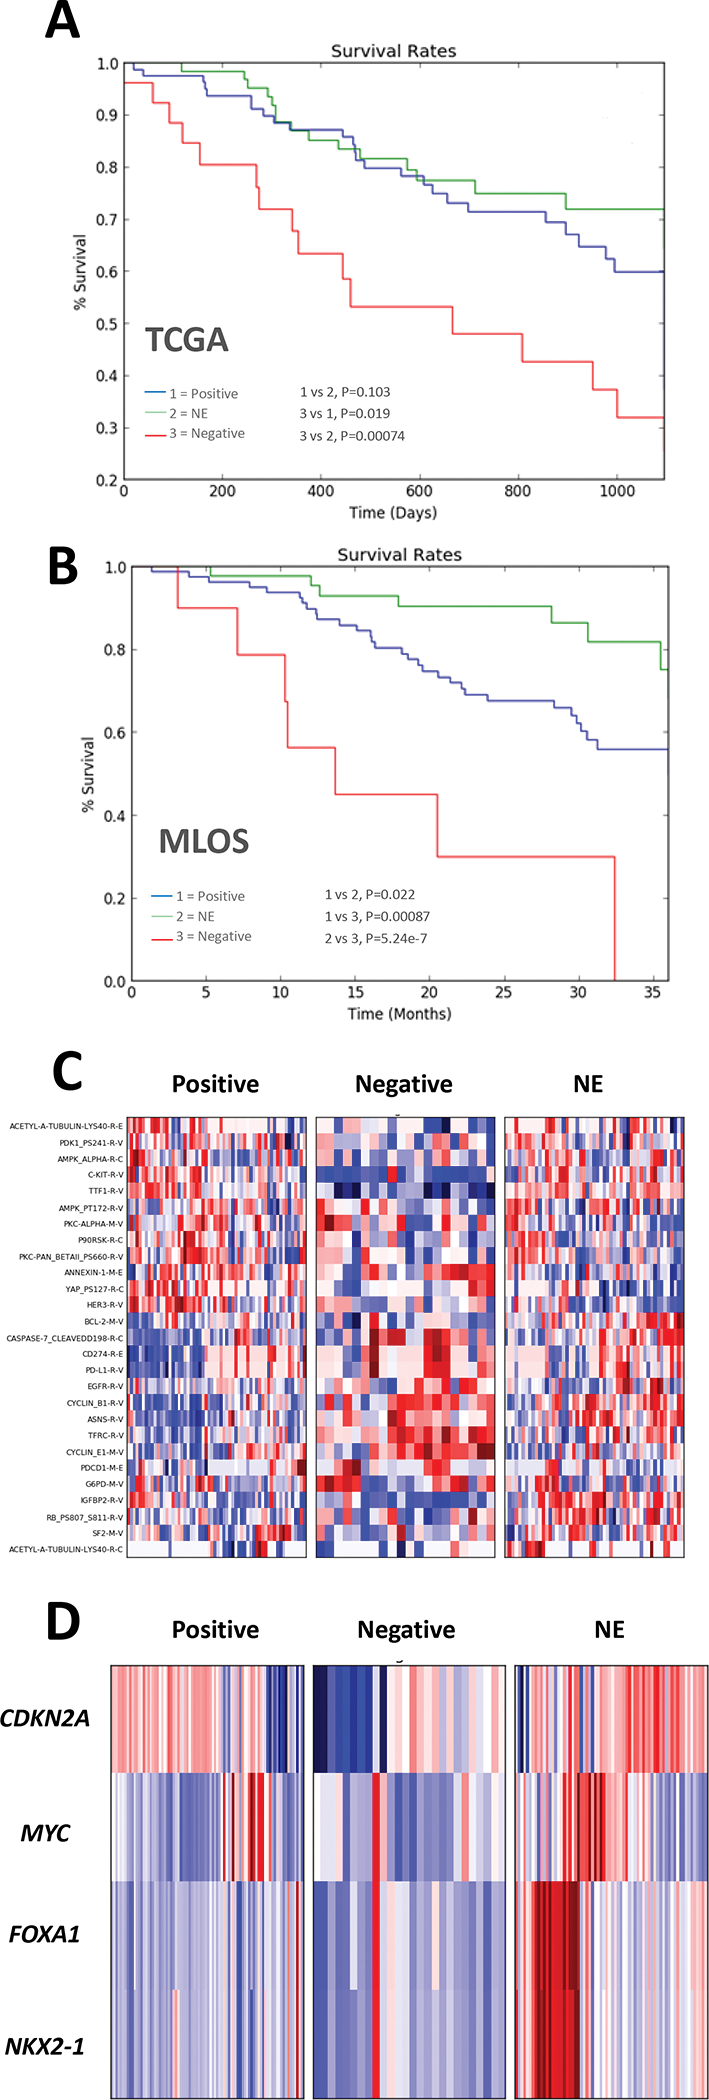
(a-b) Kaplan Meier curves of 3-year survival in TCGA (a) and MLOS (b) based on the STK11-loss subtypes. (c) Heatmap of Z-score (scale −3 to 3) transformed protein expression from TCGA RPPA (d) Heatmap of Z-score transformed copy number changes (scale −3 to 3) between the three STK11-loss subtypes.