
Figure 5 |. Ex vivo models of STK11 loss cluster with and mimic the negative subset of STK11 mutant patients lacking inflammatory signaling.
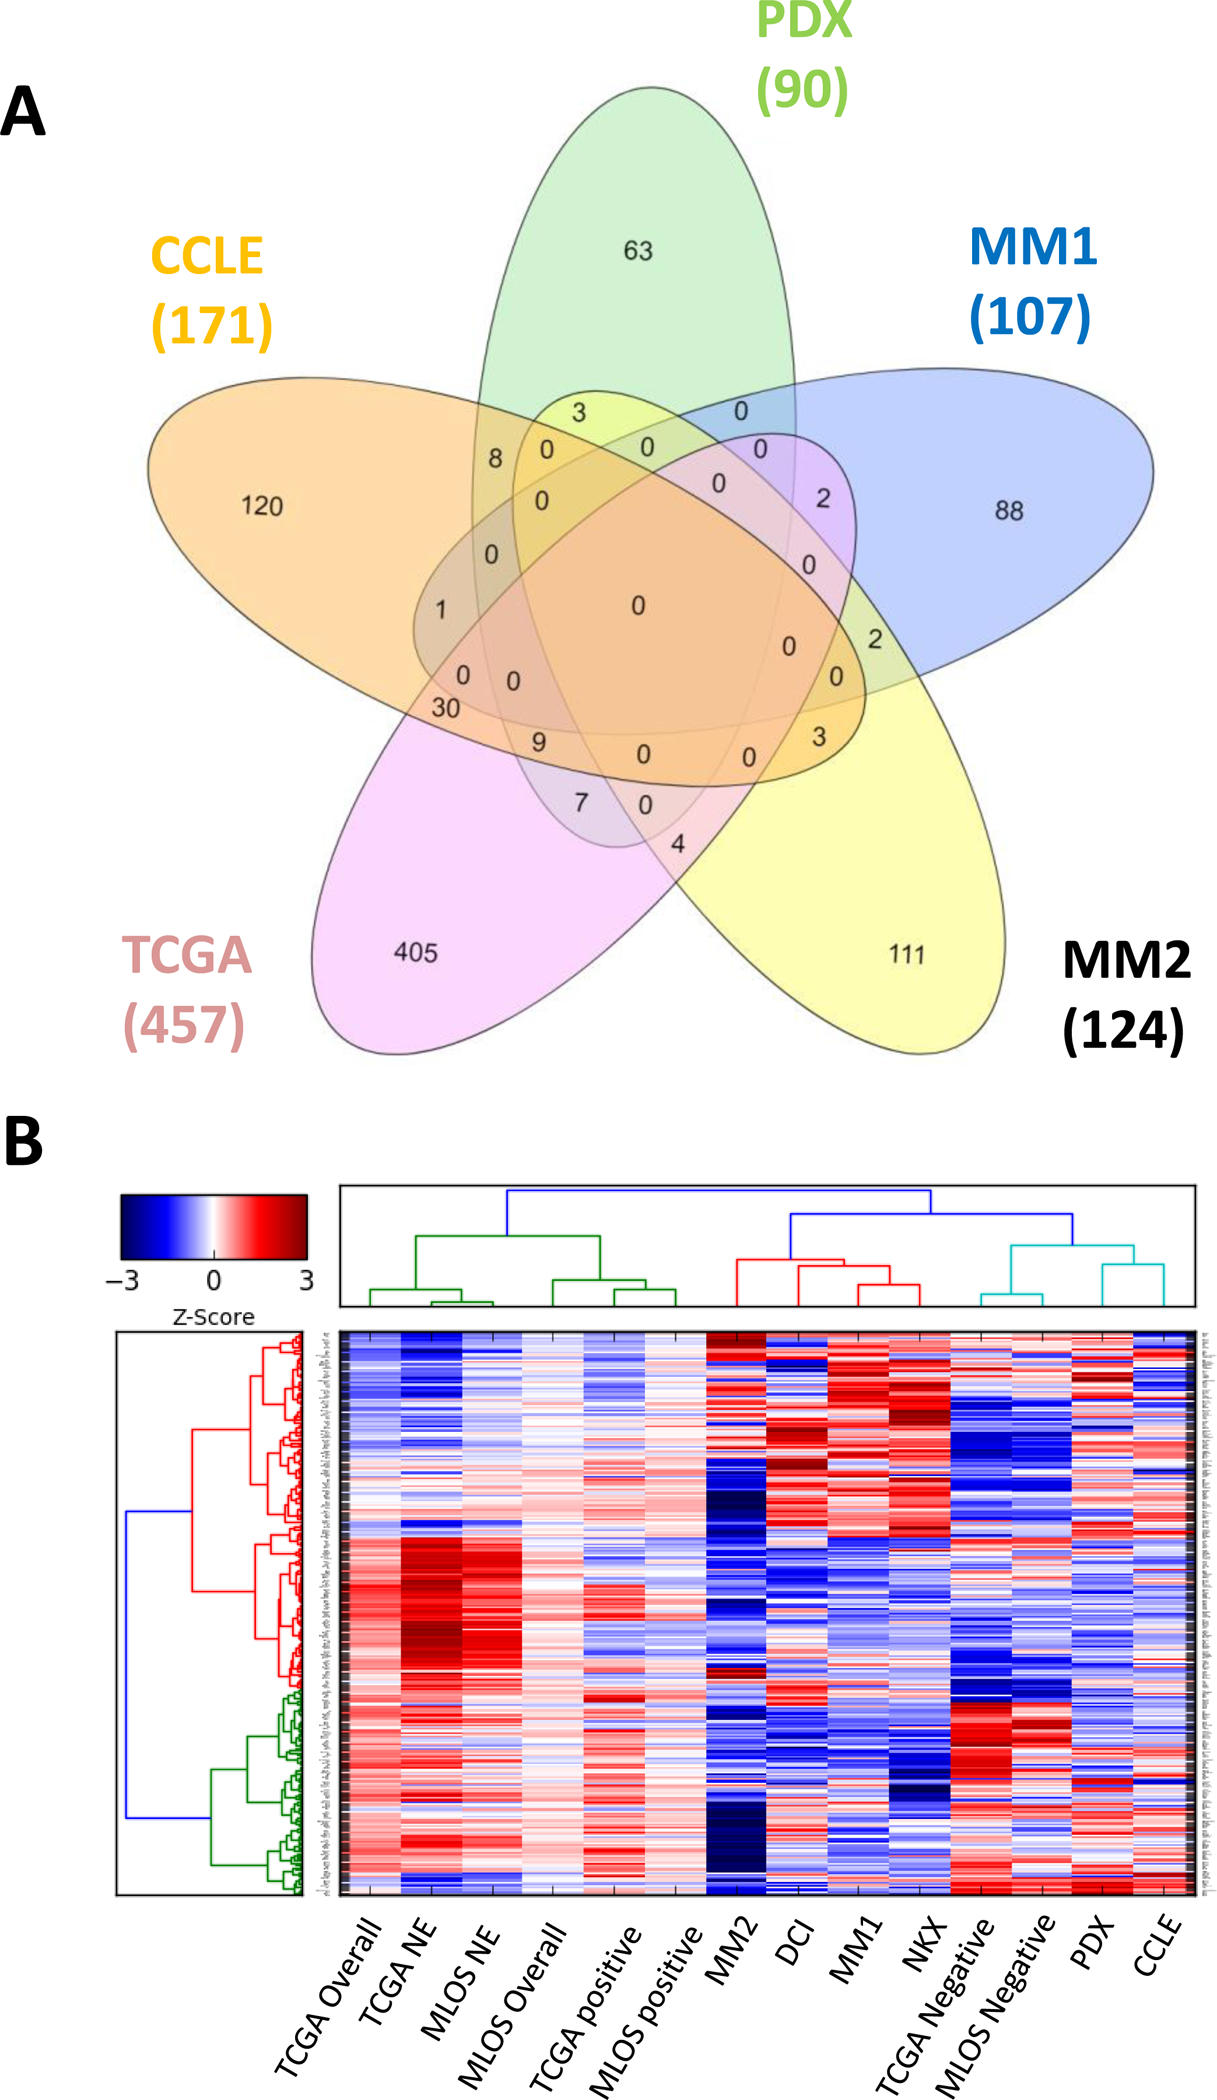
(a) 5-way Venn Diagram of average STK11 loss vs WT, cell lines (CCLE), patient-derived xenografts (PDX), and mouse models (MM1 and MM2). (b) Hierarchical clustering of gene expression fold changes of each study. TCGA and MLOS were further divided into fold changes of subtype vs WT and average vs WT. Genes selected were used for PCA signature generation.