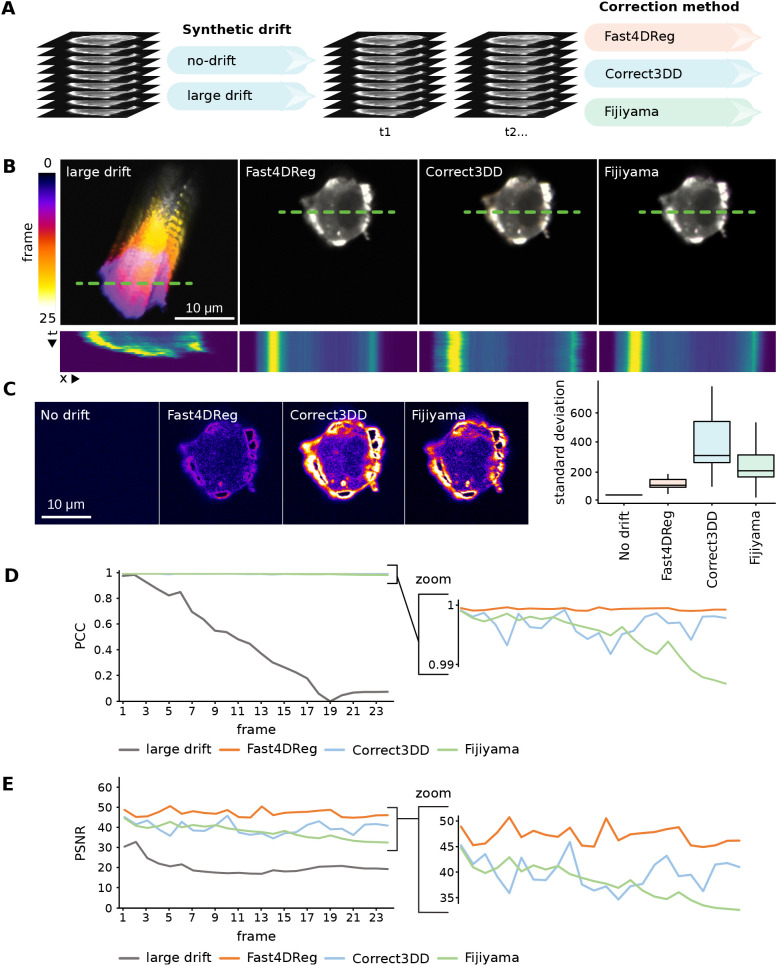
Fig. 2.
Fast4DReg outperforms Correct3DD and Fijiyama on a synthetic dataset. (A) Two synthetic 3D video datasets were created, one with no drift and another with a large amount of drift (see also Fig. S1). The large drift dataset was then corrected using Fast4DReg, Correct3DD and Fijiyama. (B) The drift-correction performance of the three algorithms was assessed using temporal color projections of a selected z-slice (middle of the cell) and kymographs (along the green dashed lines; dimensions, 25 μm × 25 frames). (C) Standard deviation time projection of the middle slice of the cell. This projection takes the standard deviation of the pixel intensities through time. Positions with large differences in the pixel intensities through the stack appear brighter in this projection. Therefore, a black image highlights no variation between the frames over time (perfect drift correction), whereas signals highlight slight errors in the drift correction. For each z-slice, the standard deviation projection over time was generated and quantified using Fiji, and the results are shown as boxplots created by PlotsOfData (Postma and Goedhart, 2019), in which the boxes show the 25th and 75th percentiles, the whiskers represent the minimum and maximum values, and the median is marked with a line. No drift shows a high baseline value as specified noise was added during background homogenization. (D,E) The Pearson's correlation coefficient (PCC) (D) and peak signal-to-noise ratio (PSNR) (E) between the first and each subsequent frame were calculated. For PSNR, a higher value indicates a better drift correction. For Pearson's correlation coefficient, a value of 1 indicates perfect drift correction. For all panels, scale bars: 10 μm.

