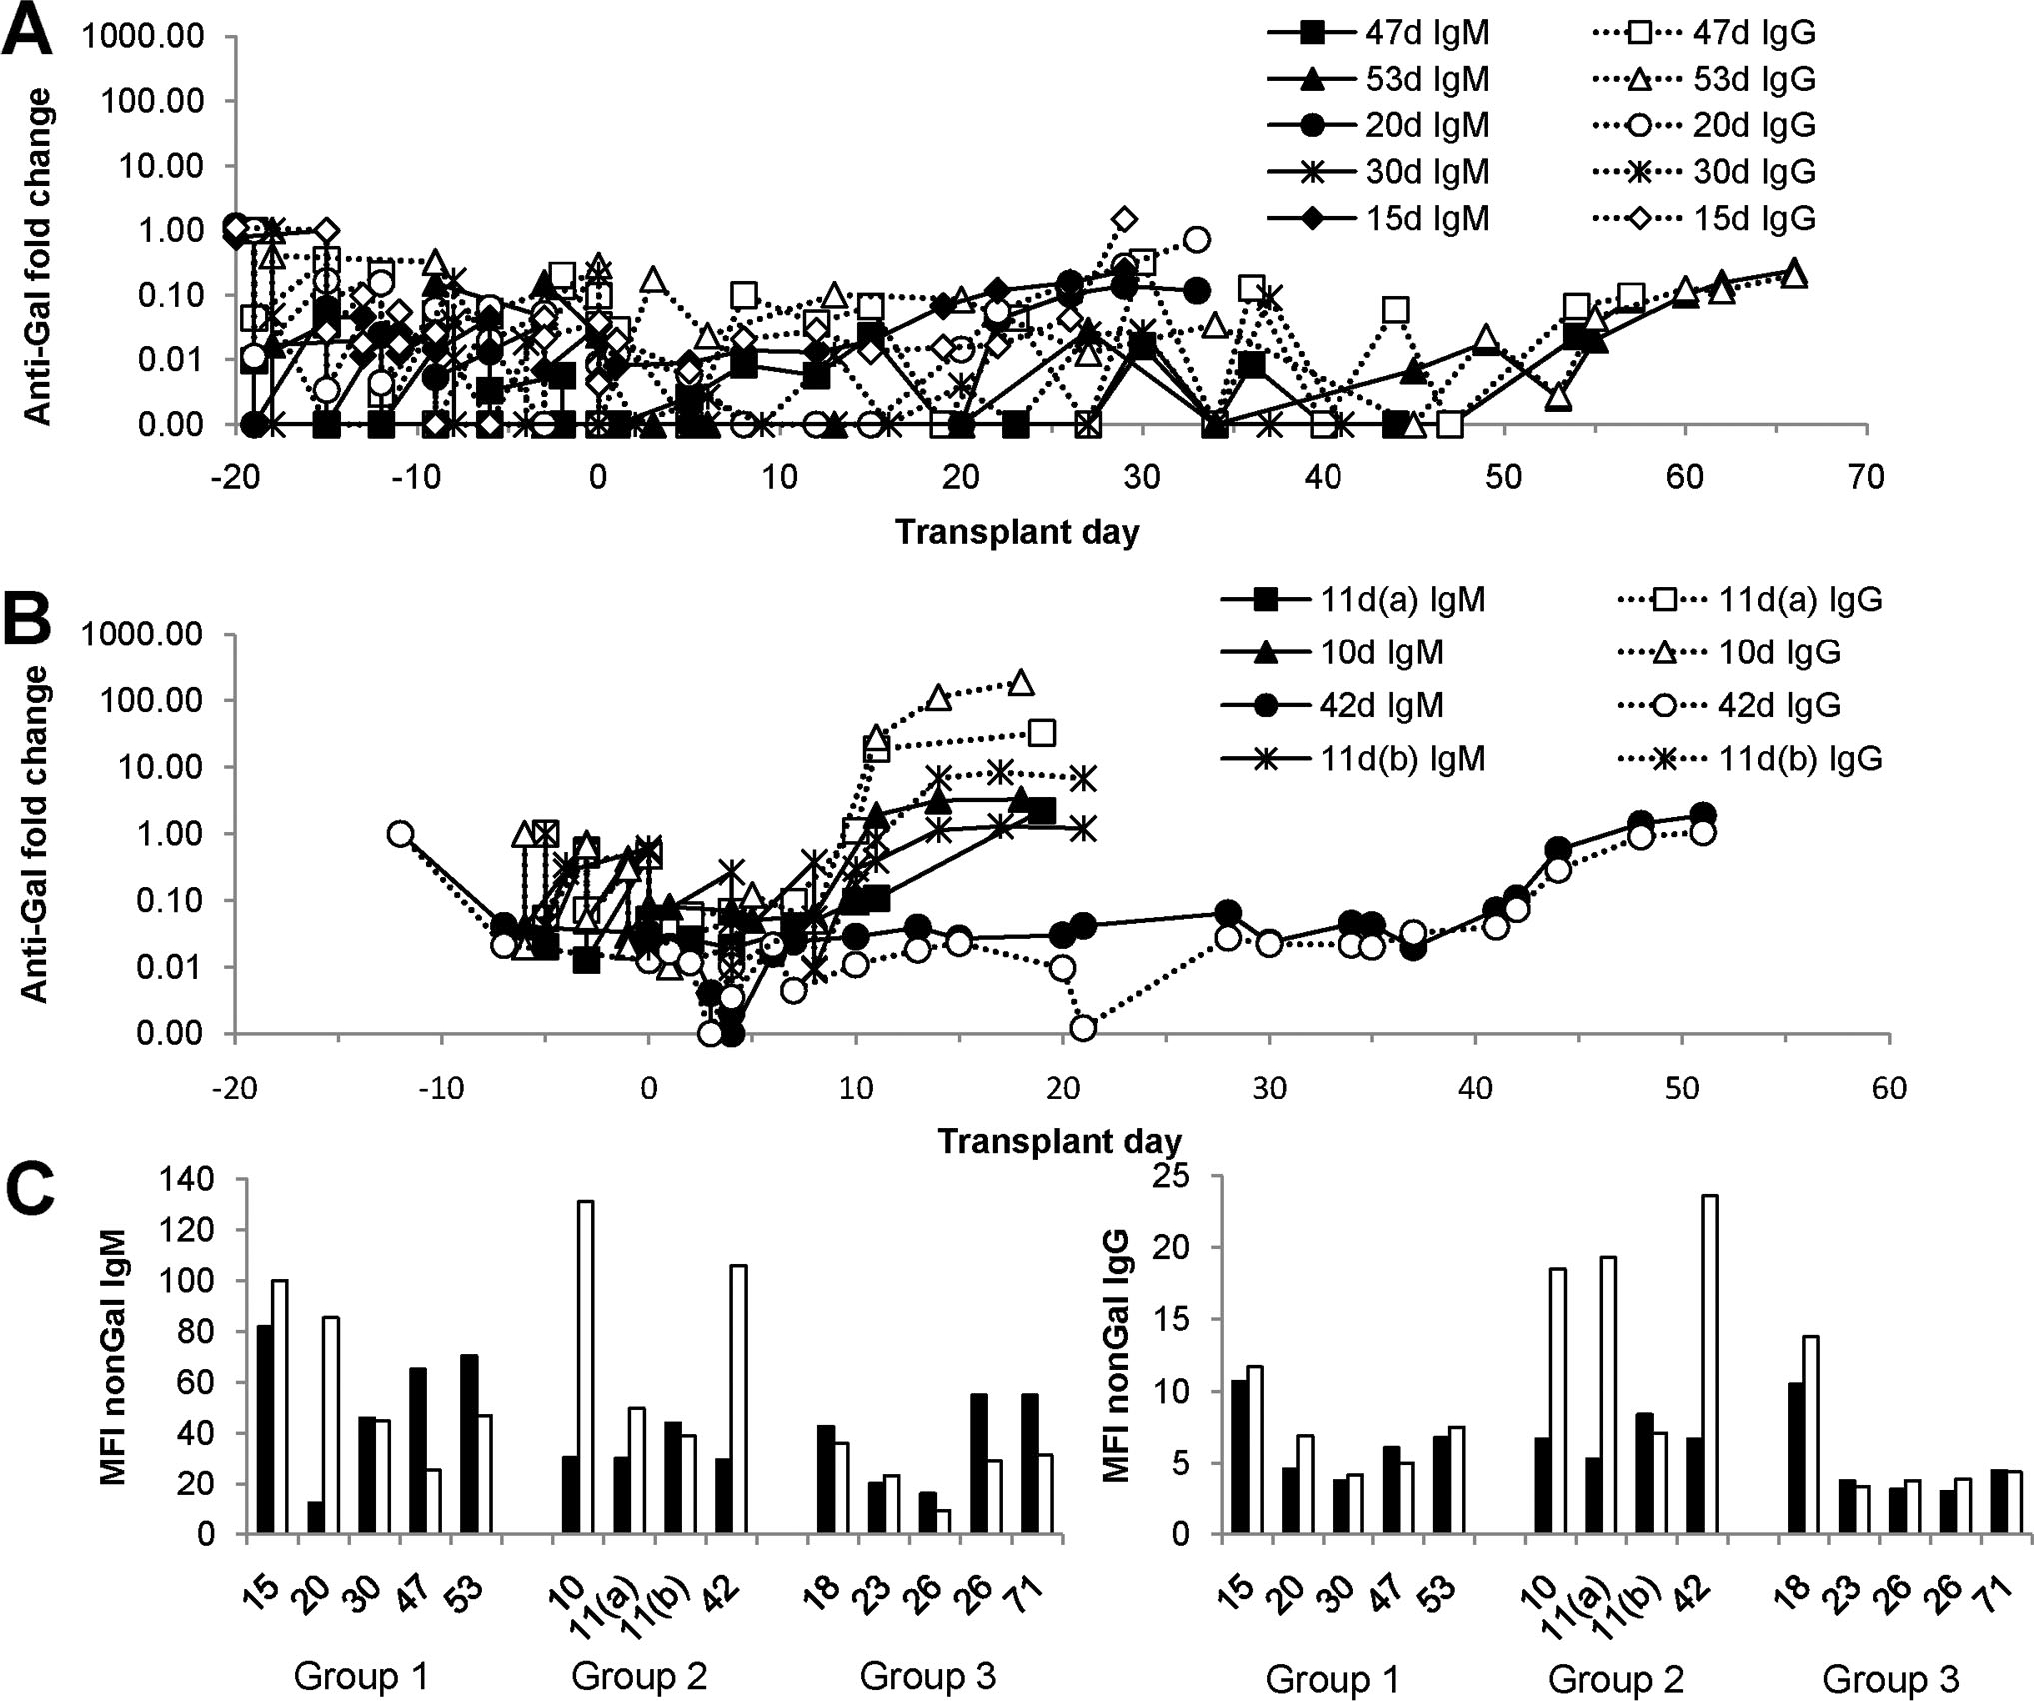
FIGURE 1.

Antibody response. The graphs depict the variation in anti-Gal (A and B) and non-Gal (C) antibody after cardiac xenotransplantation. Anti-Gal IgM and IgG were measured by enzyme-linked immunosorbent assay as previously described (38) and is depicted as the fold change compared with pretransplant serum. Non-Gal antibody was determined using flow cytometry as indicated in the Materials and Methods. (A) Group 1 anti-Gal IgM and IgG. (B) Group 2 anti-Gal IgM and IgG. A and B show antibody responses in all recipients who survived xenograft explant. The day of graft rejection for each recipient is indicated in the figure. (C) Non-Gal immune responses in groups 1–3. The graph compares non-Gal IgM (left) and IgG (right) levels in pretransplant serum (filled bars) with postexplant or necropsy serum (open bars). The numbers below the bar graphs indicate the duration of the transplant for each study group (groups 1, 2, and 3) and correspond to the values in A and B for groups 1 and 2. No group 3 recipient survived explant, so the data compare non-Gal antibody levels in pretransplant and necropsy serum.
