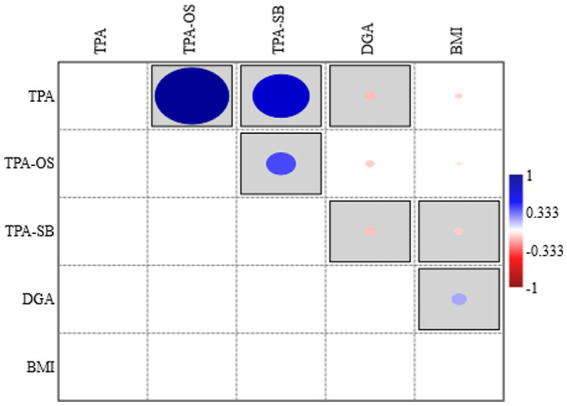
Figure 1.

The correlation graph between TPA, TPA-OS, TPA-SB, DGA scores, and BMI. TPA, total physical activity; TPA-OS, total physical activity out of school; TPA-SB, total physical activity-school based; DGA, digital game addiction; the correlation coefficients shown in the gray box represent statistical significance (p < 0.05); the size of the circle in the gray box indicates the level of correlation; blue color indicates positive and red color negative correlation.
