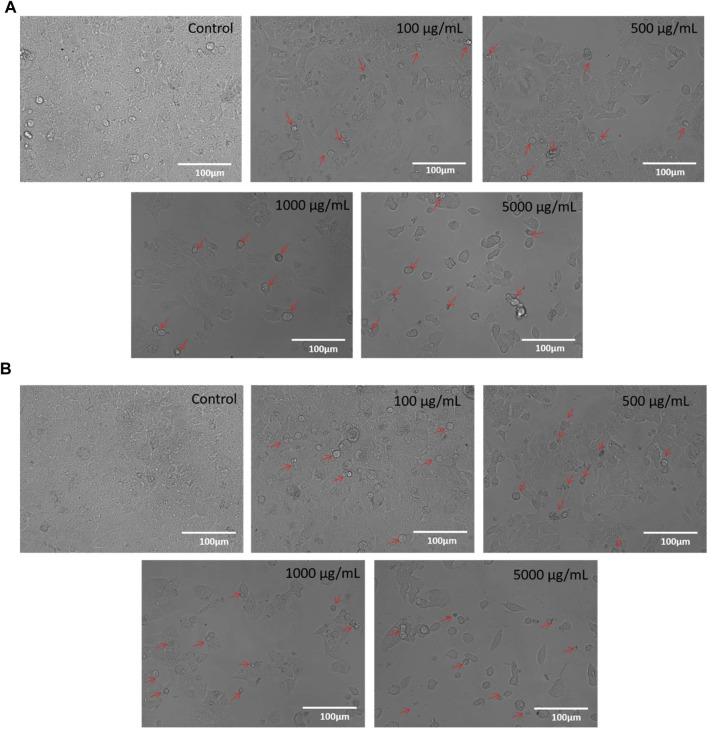
FIGURE 3.
(A): Phase-contrast images of HCT-116 cells treated with either vehicle or different doses of M1 (100–5,000 μg/mL) for 24 h. The photomicrographs shown are the representatives of three independent experiments. (B): Phase-contrast images of HCT-116 cells treated with either vehicle or different doses of M2 (100–5,000 μg/mL) for 24 h. The photomicrographs shown are the representatives of three independent experiments.

