Fig. 3.
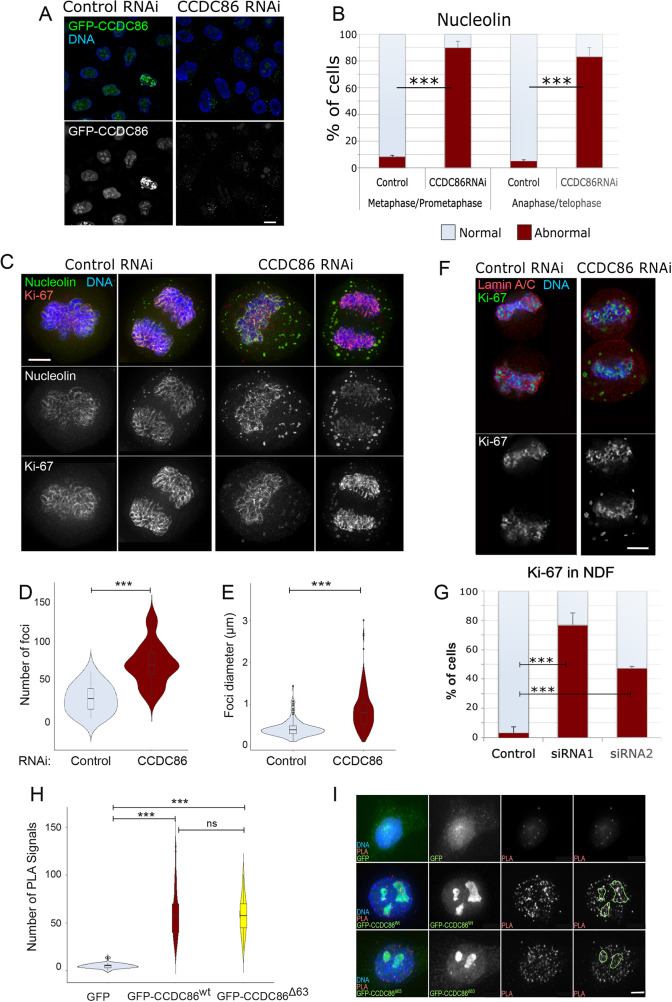
Depletion of CCDC86 compromises the mitotic localisation of nucleolin and Ki-67. (A) HeLa cells were transfected with a GFP–CCDC86 construct (green) and treated with control or CDCD86 RNAi oligo (#1) for 48 h. The cells were fixed and counterstained with DAPI (blue). Representative images showing cells with GFP–CCDC86 (green) in control RNAi and no GFP signal in CCDC86 RNAi. Scale bar: 5 µm. (B) Quantification of cells displaying an abnormal nucleolin pattern in metaphase/prometaphase or anaphase/telophase cells from the experiment in C. The graph shows the average of three independent experiments and the error bars represent the s.d. Fifty cells from each replica and condition were analysed. Statistical analyses were conducted using the χ2 test. (C) HeLa cells were treated with either control or CCDC86 siRNA for 48 h, then fixed and stained for nucleolin (green), Ki-67 (red) and DNA (blue). Representative images of a metaphase cell (left) and an anaphase cell (right) after each RNAi treatment from three independent experiments are shown. Scale bar: 5 µm. (D) Violin plots representing the number of nucleolin foci in anaphase/telophase cells from the experiment in C that were treated with control or CCDC86 siRNAs. Statistical analyses were conducted using a Wilcoxon signed-rank test. (E) Violin plots representing the diameter of nucleolin foci in anaphase/telophase cells from the experiment in C that were treated with control or CCDC86 siRNA. Statistical analyses were conducted using a Wilcoxon signed-rank test. (F) HeLa cells were treated with either control or CCDC86 siRNA (oligo #1 or oligo #2) for 48 h and then fixed and stained for Ki-67 (green), lamin A/C (red) and DNA (blue). Representative images of telophase cells (as judged by the recruitment of lamin A/C around the chromosomes) after each RNAi treatment are shown. Scale bar: 5 μm. (G) Quantification of cells displaying an abnormal Ki-67 pattern in telophase cells from the experiment in F. The graph shows the average or three experiments and the error bars represent the s.d. Statistical analyses were conducted using the χ2 test. (H) HeLa cells were transfected with either GFP, GFP–CCDC86wt or GFP–CCDCΔ63 constructs. At 24 h post transfection, cells were fixed and subjected to PLA using antibodies against GFP and Ki-67. The graph represents the number of PLA signals per cell in the three conditions. Statistical analyses were conducted using a Wilcoxon signed rank test. (I) Representative images of the experiment in H. The green masks in the fourth column represent the localisation of the nucleoli. Scale bar: 5 µm. For the violin plots, the boxes indicate the 25–75th percentiles, the whiskers show the upper and lower adjacent values and the median is marked with a line. ns, not significant; ***P<0.0001.

