Fig. 4.
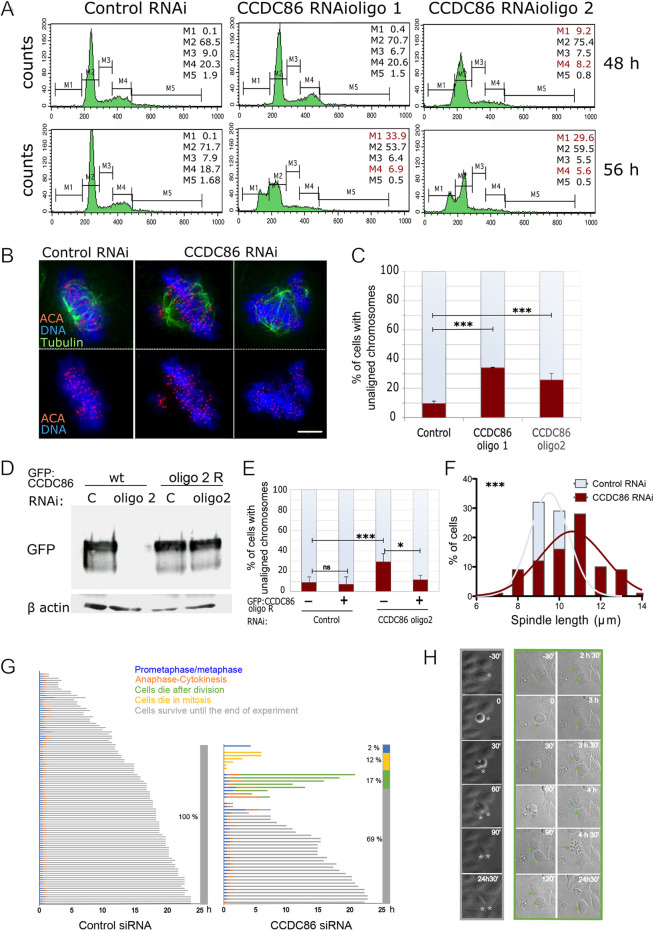
Depletion of CCDC86 compromises normal mitotic progression. (A) HeLa cells were transfected with control or CCDC86 siRNAs for 48 or 56 h. The cells were then harvested and subjected to cell cycle analyses by flow cytometry. The percentages of cells in each gated interval are shown: M1 (sub-G1), M2 (G1), M3 (S), M4 (G2) and M5 (>2N). Highlighted in red are the stages in which there is a significant deviation from the control distribution. (B) HeLa cells were treated with either control or CCDC86 siRNAs (oligo #1 or oligo #2) for 48 h and then fixed and stained for tubulin (green), anti-centromere antibody (ACA) (red) and DNA (blue). Representative images of normal metaphase cells with aligned chromosomes (left) and cells with unaligned chromosomes (right) after each RNAi treatment. Scale bar: 5 μm. (C) Quantification of mitotic cells with unaligned chromosomes from the experiment in B. The graph shows the average of three experiments and the error bars represent the s.d. n=166 (control), 228 (oligo 1) and 182 (oligo 2). Statistical analyses were conducted using the χ2 test. ***P<0.0001. (D) HeLa cells were transfected with a GFP–CCDC86wt or the siRNA-resistant construct (oligo 2 R) together with control or CCDC86 (oligo2) siRNAs for 48 h. Cells were collected and whole-cell lysates were subjected to SDS-PAGE and immunoblotting using an anti-GFP or anti-β-actin antibody. Images are representative of >10 independent experiments. (E) HeLa cells were treated as in D, then fixed and immunostained as in B. The graph shows the quantification of mitotic cells with unaligned chromosomes in the different conditions. The graph shows the average of three experiments and the error bars represent the s.d. n=166 (control untransfected), 130 (control transfected), 510 (CCDC86 RNAi untransfected), 170 (CCDC86 RNAi transfected). Statistical analyses were conducted using the χ2 test. ns, not significant; *P<0.05; ***P<0.0001. (F) Distribution of the spindle lengths obtained from the experiment in B. Pole-to-pole distances were obtained from bipolar metaphase cells when the spindle poles were in the same focal plane. n=35. Statistical analyses were conducted to compare the spindle lengths between control and CCDC86 RNAi cells by Mann–Whitney test. (G) Cell fate profiles, as determined by time-lapse microscopy, of cells treated with control or CCDC86 siRNAs. T0 represents the time each cell rounded up and images were acquired every 30 min. The different fates are colour coded as indicated in the legend. The bar at the right of each graph indicates the percentage of cells that followed each fate. Each horizontal line represents a single cell. n=108 for control siRNA, n=47 for CCDC86 siRNA. (H) Frames from time-lapse imaging of CCDC86 siRNA cells that divided and survived until the end of the experiment (left, grey frames and grey asterisks) and cells that died after division (right, green frames and green asterisks; the green arrow indicates the daughter cell that died).

