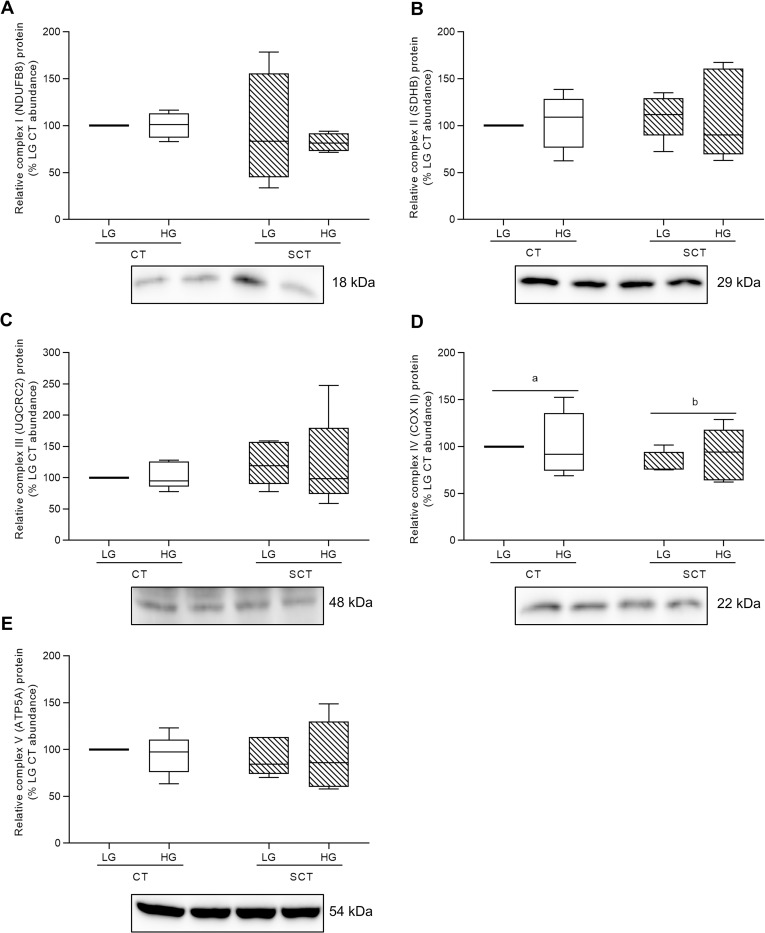
Fig 4. HG culture conditions do not impact protein expression of electron transport chain complexes in BeWo trophoblasts.
Relative protein abundance of (A) Complex I (NDUFB8 subunit) (B) Complex II (SDHB subunit) (C) Complex III (UQCRC2 subunit) (D) Complex IV (COX II subunit), and (E) Complex V (ATP5A subunit) of the electron transport chain (ETC) in HG-cultured BeWo trophoblasts. Different lower-case letters denote differentiation state-dependent differences in ETC complex protein abundance between CT and SCT cells (n = 4-5/group; Two-Way Randomized Block ANOVA (2WA)). ETC complex protein band density was normalized to total lane protein (ponceau) for statistical analysis and the data is presented as percent of LG CT protein abundance for visualization. Full length representative images of ETC complex bands and ponceau staining of total lane protein are available in S2 Fig in S1 File.

