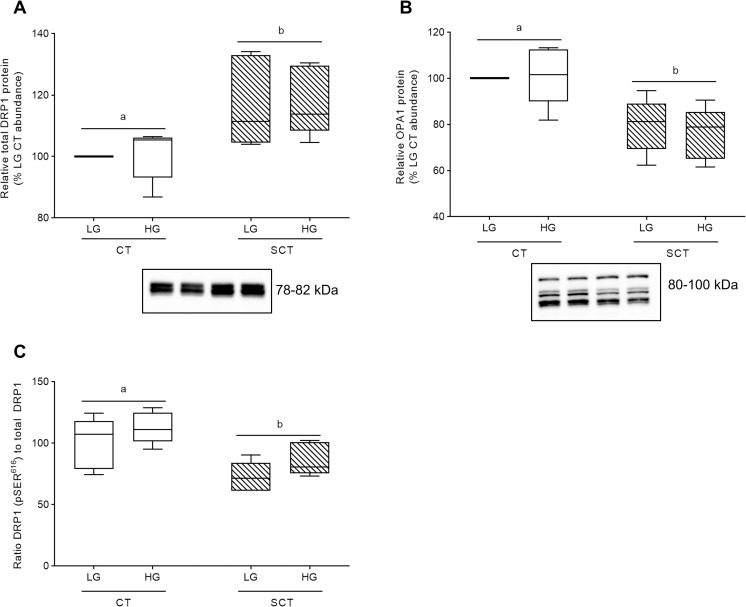
Fig 5. Syncytialization impacts mitochondrial dynamics in BeWo trophoblasts.
Relative protein abundance of (A) total DRP1, (B) OPA1, and (C) ratio of pSER616 DRP1 to total DRP1. Different lower-case letters denote differentiation state-dependent differences in relative protein abundance between CT and SCT cultures (n = 5/group; Two-Way Randomized Block ANOVA (2WA), Sidak’s multiple comparisons test). Protein band density was normalized to total lane protein (ponceau) for statistical analysis and the total protein abundance data is presented as percent of LG CT abundance for visualization. Protein band density data from each membrane was normalized to the average LG CT protein band density prior to calculation of the phosphorylated protein abundance-to-total protein abundance ratio. Uncropped representative images of protein bands and ponceau staining of total lane protein are available in S4 and S5 Figs in S1 File.

