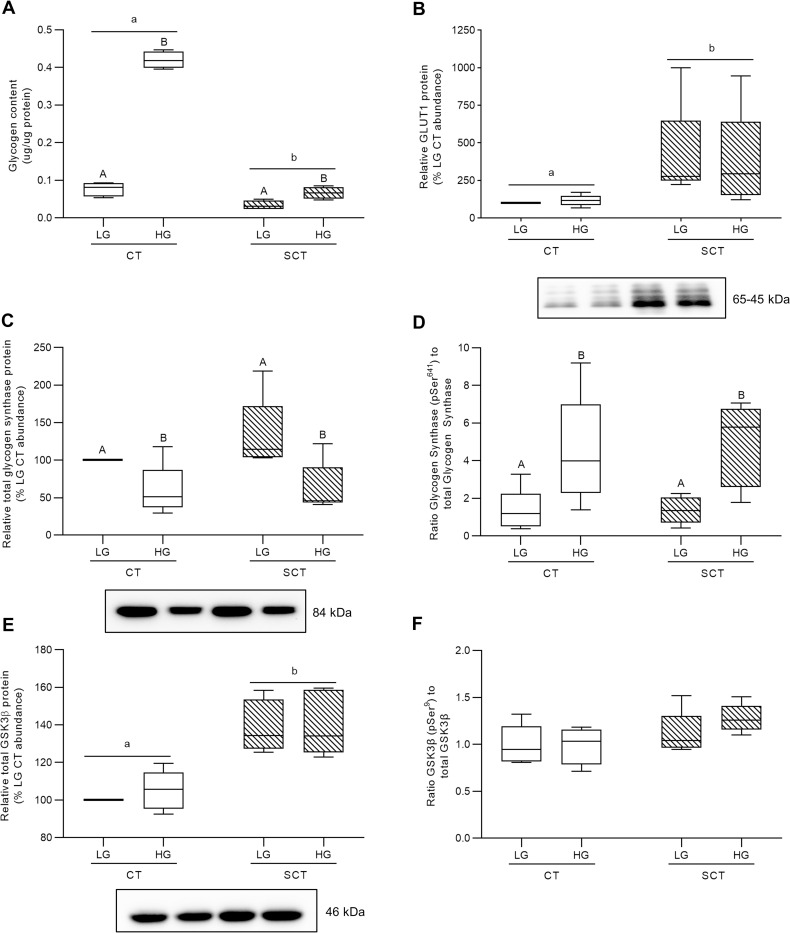
Fig 6. HG culture conditions impact glycogen storage and regulation in BeWo trophoblasts.
(A) Glycogen content and relative protein abundance of (B) GLUT1 (C) glycogen synthase; (D) the pSer641 glycogen synthase-to-total glycogen synthase ratio; (E) GSK3β; and (F) the pSer9 GSK3β-to-total GSK3β ratio in HG-treated BeWo trophoblasts at T72H. Different lower-case letters denote differentiation state-dependent differences in protein abundance between CT and SCT cultures, and different upper-case letters denote glucose-level dependent differences within a differentiation state (Randomized-Block Two-Way ANOVA (2WA), and Sidak’s multiple comparisons test, p<0.05). Glycogen content data are presented as protein normalized glycogen abundance (μg glycogen per μg protein; n = 4/group). Protein band density was normalized to total lane protein (ponceau) for statistical analysis and the data is presented as percent of LG CT abundance for visualization (n = 5/group). Protein band density data from each membrane was normalized to the average LG CT protein band density prior to calculation of the phosphorylated protein abundance-to-total protein abundance ratio. Uncropped representative images of protein bands and ponceau staining of total lane protein are available in S6 Fig in S1 File.

