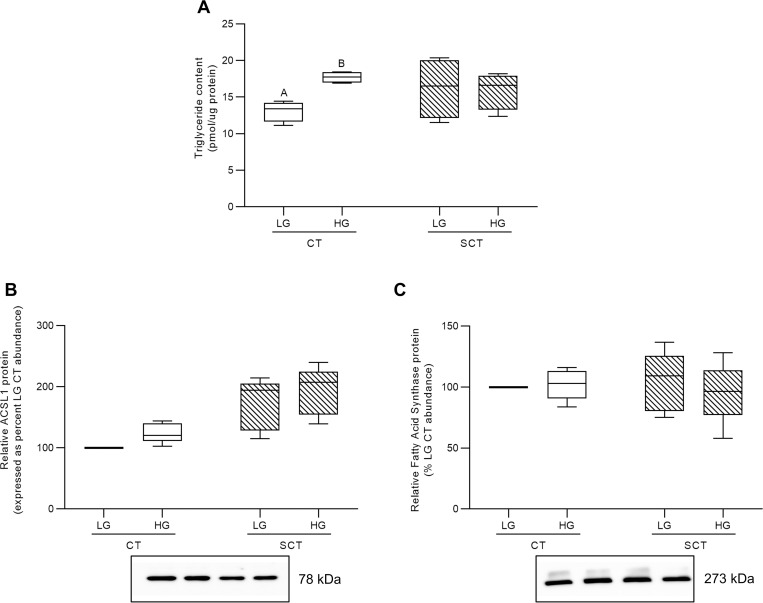
Fig 7. HG culture conditions impact triglyceride content in BeWo CT cells.
(A) Triglyceride content and relative protein abundance of (B) ACSL1, and (C) FASN in HG-treated BeWo trophoblasts at T72H relative abundance. Different upper-case letters denote hyperglycemia-dependent differences between LG and HG treatments within each respective differentiation state (Two-Way Randomized Block ANOVA; Sidak’s multiple comparisons test, p<0.05). TG content data is presented as protein normalized TG abundance (pmol TG per μg protein; n = 4/group). Protein band density was normalized to total lane protein (ponceau) for statistical analysis and the data is presented as percent of LG CT abundance for visualization (n = 5/group). Uncropped representative images of protein bands and ponceau staining of total lane protein are available in S4 Fig in S1 File.

