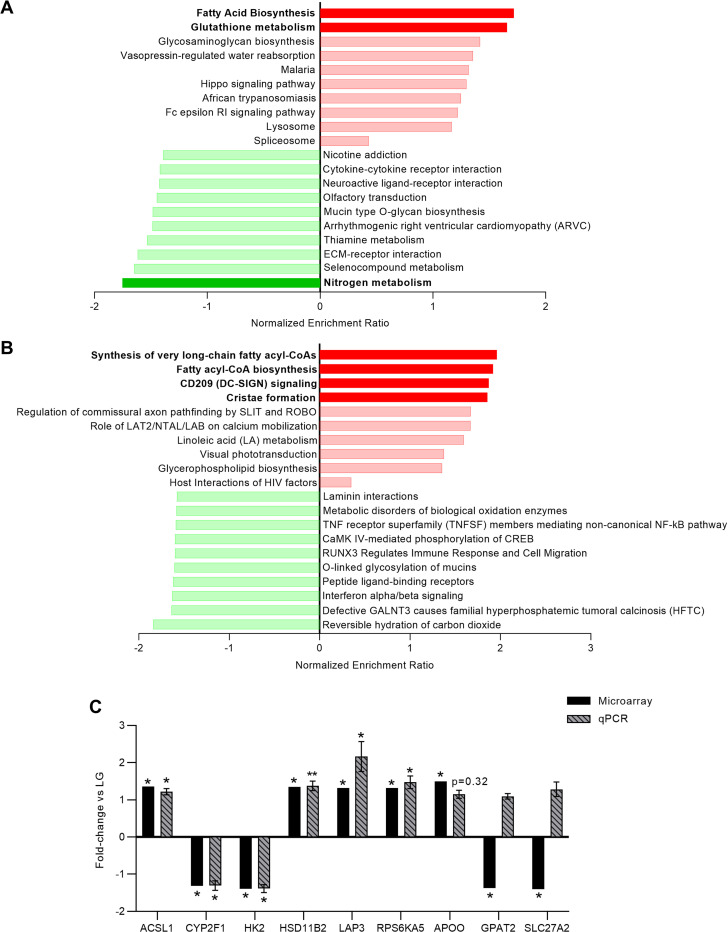
Fig 9. Gene set enrichment analysis of differentially expressed genes and RT-qPCR validation of microarray gene changes.
(A) Top 10 up-regulated and down-regulated KEGG gene sets and (B) top 10 up-regulated and down-regulated Reactome gene sets (by normalized enrichment ratio) in HG-cultured BeWo CT cells. Green bars represent down-regulated gene sets and red-bars represent up-regulated gene sets, with dark green bars representing significantly down-regulated and dark red bars representing significantly up-regulated gene sets (FDR-p<0.25). The transcripts identified in the microarray were ranked by signal-to-noise ratio using the Gene Set Enrichment Analysis Software, and enrichment analysis was performed using WebGestalt. (C) RT-qPCR was utilized to validate the differential expression of ACSL1, CYP2F1, HK2, HSD11B2, LAP3, and RPS6KA5 in HG-cultured BeWo CT cells. Data was analyzed via paired t-test (*p<0.05, **p<0.01, n = 9-10/group), and data expressed as fold-change vs LG BeWo CT (mean ± SEM). Down-regulated genes ratios were inversed and expressed as a negative (e.g 0.5-fold is expressed as a minus-2 fold-change).

