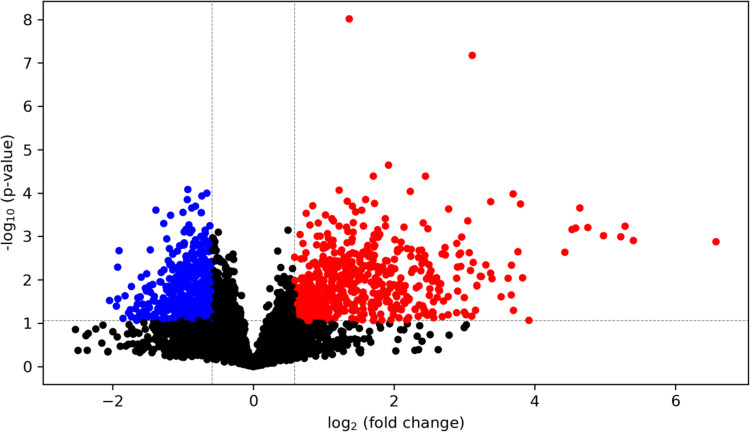
Fig 10. Visualization of differentially abundant metabolites in HG-cultured BeWo CT cells.
A volcano plot was constructed to visualize the differentially abundant metabolites in HG-cultured BeWo CT cells ((≥ ±1.5-fold change, p<0.05, n = 5/group). Overall, 720 metabolites were found to be differentially abundant in HG-cultured BeWo CT cells. Of these metabolites, 4 were identified in tier 1 (all increased in abundance) and 89 were identified in tier 2 (22 decreased in abundance, and 67 increased in abundance) with high confidence. The x-axis indicates log2(fold-change) vs LG BeWo CTs, and the y-axis indicates the p-value (-log10). The red dots represent significantly increased metabolites, and the blue dots represent significantly decreased metabolites in HG-cultured BeWo CT cells.

