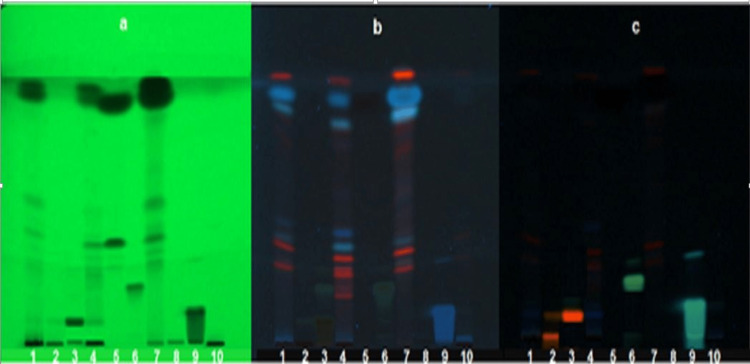
Figure 3. TLC profile at 254 nm (a), TLC profile at 330 nm (b), TLC profile after derivatizing with NP reagent (c).
1: methanol extract, 2: rutin standard, 3: quercetin standard, 4: EtOAc extract, 5: cinnamaldehyde standard, 6: kaempferol standard, 7: hexane extract, 8: catechin standard, 9: caffeic acid standard, and 10: butanol extract.
TLC Plate 2: Mobile Phase: Chloroform: Methanol: Formic acid (9.5:0.4:0.1).

