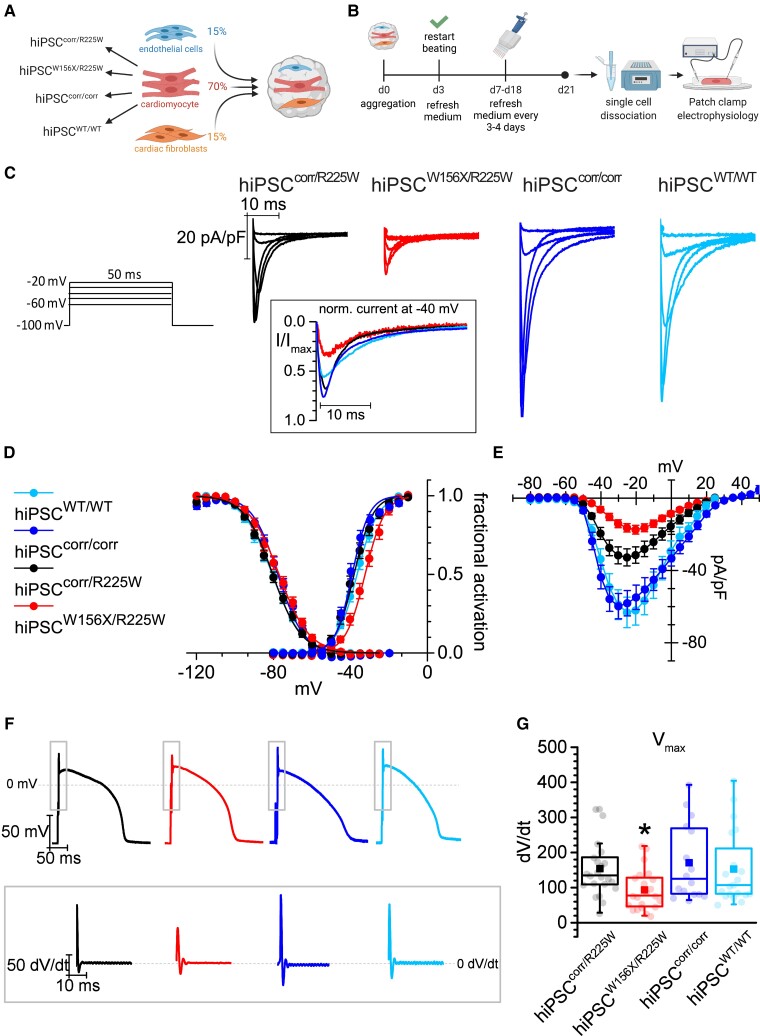
Figure 4.
Electrical maturation of hiPSC-CMs in 3D cardiac microtissues with hiPSC-derived non-myocytes reveals functional effects of p.R225W SCN5A mutation. (A) Schematic of the microtissue formation using hiPSC-CMs from four lines (hiPSCcorr/R225W, hiPSCW156X/R225W, hiPSCcorr/corr, hiPSCWT/WT) and ECs and CFs from hiPSCWT/WT. The percentage of each cell type is indicated. (B) Schematic of 21-day MT culture protocol until single-cell dissociation for analysis. (C) Representative INa traces recorded in hiPSCcorr/R225W-, hiPSCW156X/R225W-, hiPSCcorr/corr-, and hiPSCWT/WT-CMs dissociated from MTs, corresponding to the voltage steps reported on the right. In the inset, the current at −40 mV normalized to the peak current, to compare the fraction of open channels around the V1/2 of activation. (D) Activation (AC) and inactivation (IC) curve of INa recorded in hiPSCcorr/R225W- (black; AC: V1/2 = −38.1 ± 1.2 mV; IC: V1/2 = −80.6 ± 1.1 mV; n = 16), hiPSCW156X/R225W- (red; AC: V1/2 = −32.4 ± 1.2 mV*, n = 11; IC: V1/2 = −77.3 ± 1.4 mV, n = 9), hiPSCcorr/corr- (blue; AC: V1/2 = −39.3 ± 0.9 mV, n = 17; IC: V1/2 = −77.9 ± 1.2 mV; n = 16), and hiPSCWT/WT- (light blue; AC: V1/2 = −36.5 ± 0.9 mV, n = 8; IC: V1/2 = −80.8 ± 1.3 mV, n = 7) CMs showing a rightward shift in INa activation in hiPSCW156X/R225W-CMs. *P < 0.05 vs. the other lines with one-way ANOVA and Fisher’s post hoc test. Experiments = 3. (E) Mean voltage-density plot of INa recorded in hiPSCcorr/R225W- (black), hiPSCW156X/R225W- (red), hiPSCcorr/corr- (blue), and hiPSCWT/WT- (light blue) CMs, showing a reduction in current density in hiPSCW156X/R225W- and hiPSCcorr/R225W-CMs compared with the corrected and WT line and a shift in the activation of hiPSCW156X/R225W-CMs. From −45 to −20 mV: P < 0.05 for hiPSCW156X/R225W and for hiPSCcorr/corr vs. the other lines with two-way ANOVA repeated measures. Experiments = 3. (F) Representative AP traces recorded with dynamic clamp from hiPSCcorr/R225W- (black), hiPSCW156X/R225W- (red), hiPSCcorr/corr- (blue), and hiPSCWT/WT- (light blue) CMs paced at 1 Hz. The inset indicates the respective derivative trace of the AP after the stimulus. (G) Box plot of mean Vmax of APs recorded in hiPSCcorr/R225W- (black, n = 23), hiPSCW156X/R225W- (red, n = 22), hiPSCcorr/corr- (blue, n = 17), and hiPSCWT/WT- (light blue, n = 20) CMs. Dots: single values, lines: median, squares: mean, error bars: 1.5× IQR. *P < 0.05 vs. the other lines with one-way ANOVA and Fisher’s post hoc test. Experiments = 4.

